Evaluation vs. Summarization Accuracy
Overview
When exploring forecast accuracy, it is important to identify both the dimensional and frequential granularity at which accuracy should be “evaluated” and that by which it should be “summarized”. This is because accuracy can vary depending on the dimensional and frequential granularity at which error evaluation occurs.
Example
Demonstrated in the image below, this phenomenon results from the inherent netting of positive and negative “misses” when aggregating up dimensionalities or frequencies.
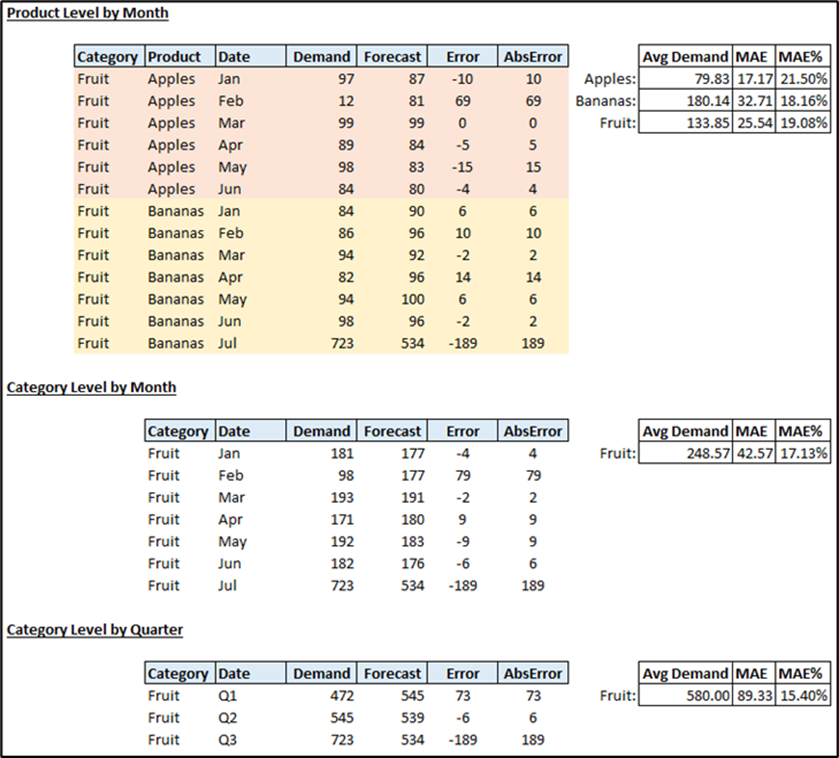
The forecast for product of Apples missed by -10 units in January, and the forecast for product of Bananas missed by +6 units in January. The total absolute error at the Product level is 16, but the total absolute error when evaluating at the Category level (value of “Fruit”) is 4.
The same phenomenon can occur with frequential aggregation. Thus, an individual reviewing forecast accuracy should always be aware of the level at which accuracy is evaluated to mitigate misinterpretations of true accuracy.