Error Metrics Explained
What are Error Metrics?
Error metrics in time series forecasting are measures used to evaluate the accuracy of predictions made by forecasting models. They quantify the difference between the actual and predicted values, providing insight into the performance and effectiveness of the forecasting models.
How do I Use Error Metrics?
Error metrics in time series forecasting are used to assess the performance of forecasting models by quantifying the accuracy of their predictions. They allow analysts and data scientists to compare different models, tune parameters, and identify areas for improvement. By analyzing error metrics such as mean absolute error (MAE), mean squared error (MSE), or root mean squared error (RMSE), practitioners can make informed decisions to optimize forecasting models and enhance their predictive capabilities.
What Error Metrics are typically used in SensibleAI Forecast?
SensibleAI Forecast has a suite of error metrics that can be leveraged when executing Rapid Project Experimentation. Traditionally, mean squared error (MSE) and mean absolute error (MAE) are used most frequently when conducting Rapid Project Experimentation. In summary, while MAE and MSE quantify prediction errors, MAE provides a more intuitive understanding of the average error magnitude. At the same time, MSE emphasizes the impact of larger errors due to squaring. The choice between them depends on the specific requirements and priorities of the forecasting task.
Error Metric Definitions
Below is a diagram of the 4 most common error metrics that are leveraged to interpret how well models have done in experimentation.
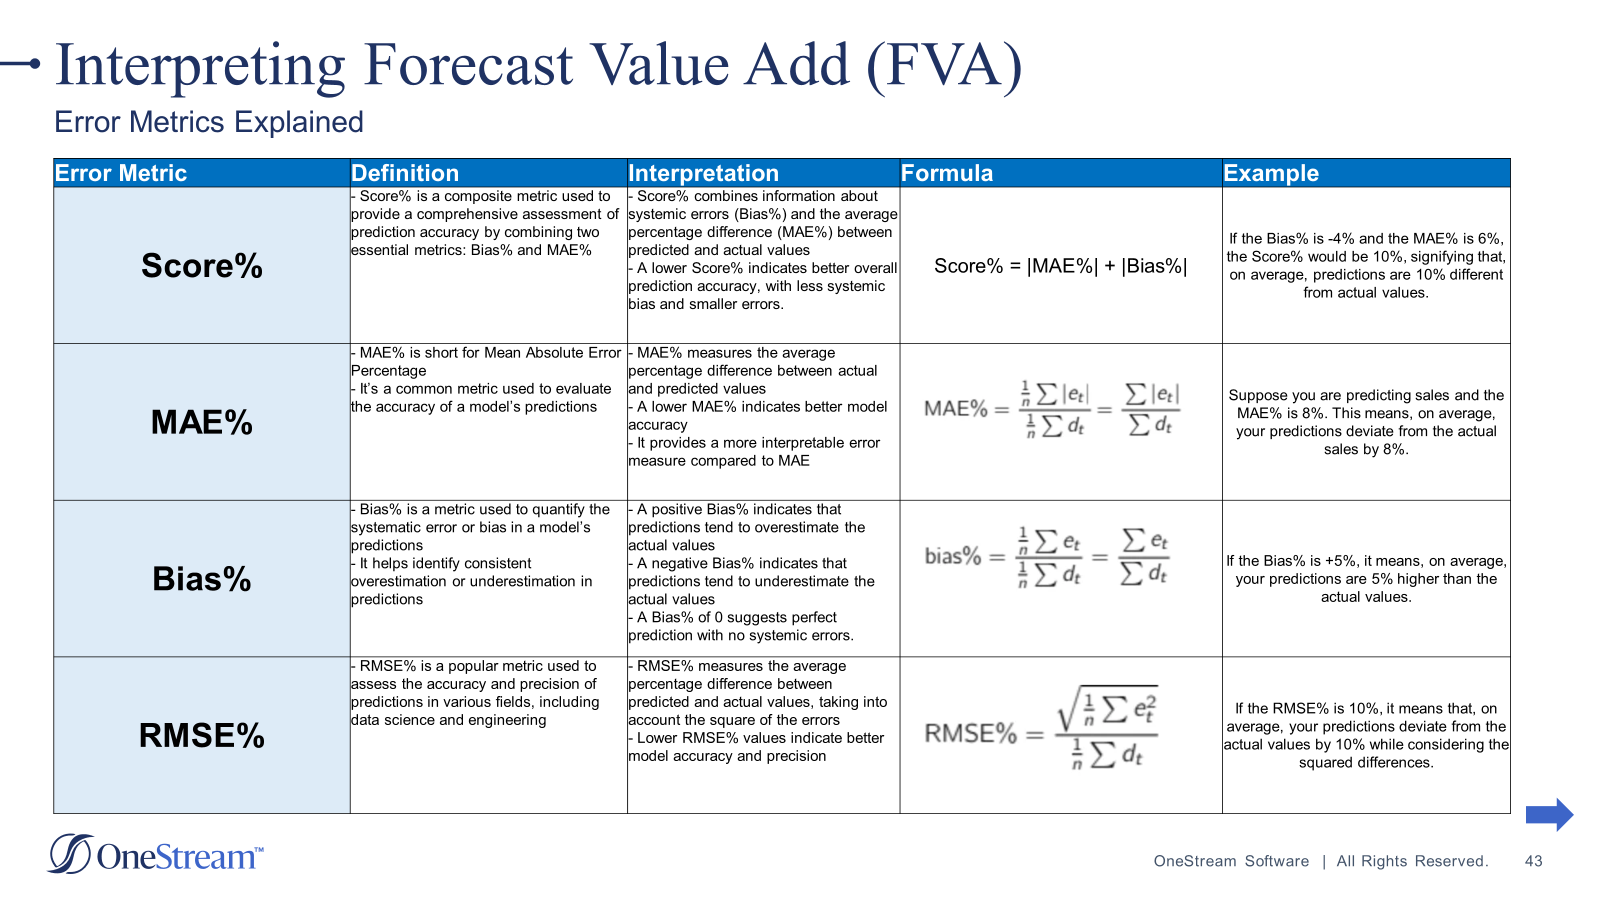
It's paramount not to rely solely on one error metric when evaluating the performance in SensibleAI Forecast because different metrics provide unique insights into its efficacy. While one metric may spotlight the overall accuracy of predictions, another, such as bias, might reveal the model's tendency to consistently overestimate or underestimate values.
By considering a range of error metrics such as Mean Absolute Error (MAE), Mean Squared Error (MSE), Root Mean Squared Error (RMSE), and bias, SensibleAI Forecast power users gain a comprehensive understanding of SensibleAI Forecast’s performance across various dimensions. This multi-dimensional evaluation not only helps in identifying potential areas for improvement but also aids in fine-tuning model parameters to achieve better overall forecasting accuracy. Evaluating SensibleAI Forecast from multiple perspectives ensures a more robust assessment and enhances the reliability and effectiveness of the forecasting process.