Cross Validation: Manual Model Setup
In an effort to provide additional insight to the Cross Validation: Establishing Splits article, the purpose of the below content is to explain how to create a manual model for setting up the cross-validation splits. As highlighted in the aforementioned article, setting up cross-validation splits is the process of separating the target dataset into multiple subsets to train, validate, test, and holdout over different periods of time. This division of data and reapplication of the train, val, test, and holdout process increases SensibleAI Forecast’s confidence and accuracy in selecting the best model for the job.
Manual Model Setup
The default cross-validation settings inherent to SensibleAI Forecast based on the number of historical datapoints provided are explained in the below image:
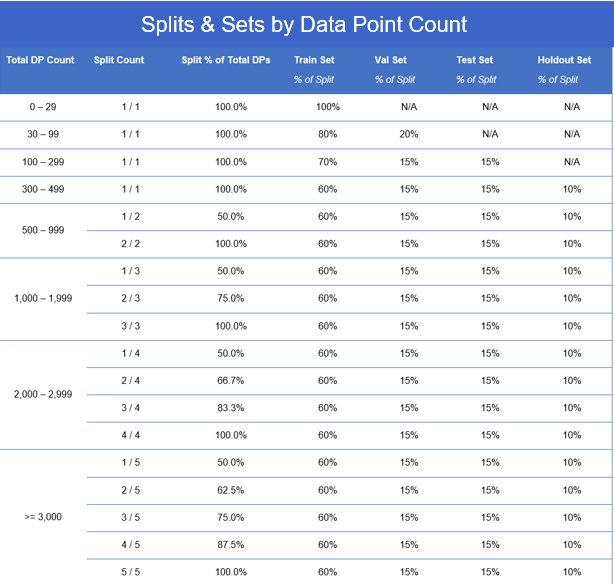
Depending on situation, there may be instances in which the model builder may desire to manually select the cross-validation strategy for the data being fed to SensibleAI Forecast. One example of a situation that could trigger this would be if the data in the train set does not cover two full annual cycles. When SensibleAI Forecast is provided a limited amount of data to the train set, the engine is not able to establish a consistent correlation of recurring events or time-based features if it only sees them occur one time.
In order to effectively set up the manual cross validation splits, the model builder must first understand both the total number of data points available and how many data points will be used for the benchmark comparison period. After removing the benchmark comparison from the total datapoint count, the model builder will be left with the number of datapoints that will be fed to SensibleAI Forecast. This will direct the user on the number of splits and recommended breakout of the train, val, test, and holdout sets based on the image above. Considering the aforementioned hypothetical situation in which the user wants to ensure two full annual cycles in the train set, there may be a need to adjust the breakouts resulting in a custom cross-validation strategy.
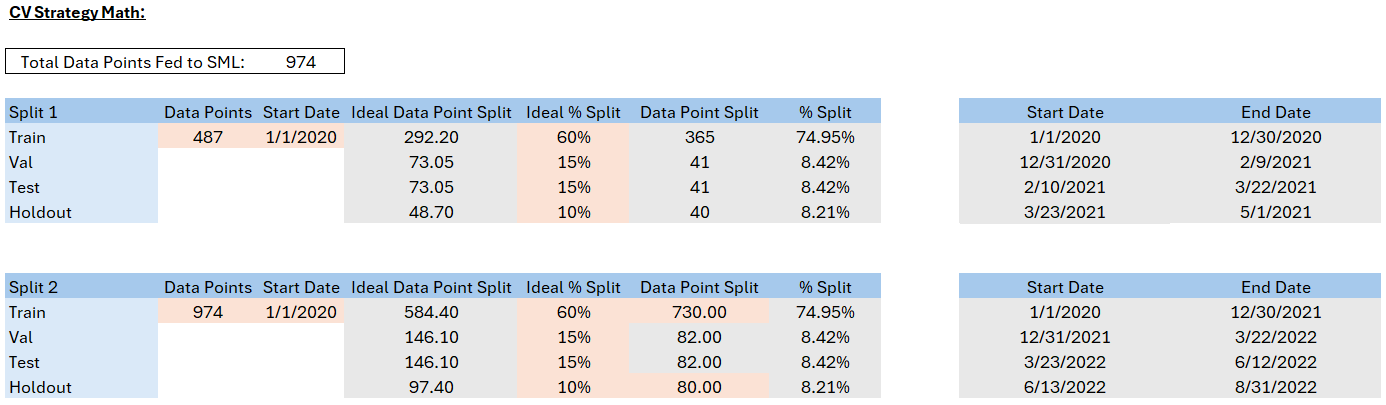
Adding numbers to the hypothetical scenario, the above model shows the breakout of data based on a situation in which 974 data points were fed to SensibleAI Forecast after benchmark comparison data points were removed from the total dataset. This datapoint count falls into the 500-999 threshold which has a default cross-validation strategy of 2 splits (Split 1 - 50%, Split 2 - 100%), with the train, val, test, and holdout sets being made up of 60%, 15%, 15%, and 10% respectively.
Considering the Train set, 60% of 974 = 584 data points; at the daily level this does not cover two full annual cycles (365 days x 2 = 730 data points). When adjusting the train set to 730 data points, you can see that it now makes up just under 75% of the data fed to SensibleAI Forecast. This results in the need to reduce the number of data points that make up the val, test, and holdout sets. The user can then manually set a holdout set datapoint threshold with best judgment and establish if the resulting val and test sets are acceptable to continue moving forward.
Upon confirmation, the user is then able to apply the datapoint counts or percentages to the start date for both Split 1 and Split 2 to understand the date segmentation of the train, val, test, and holdout sets. This process is outlined below.
Model Calculations
Orange Cells = Manual Inputs | Grey Cells = Calculations
-
Data Points (Split 2): Total number of data points fed to SensibleAI Forecast
-
Data Points (Split 1): Total number of data points fed to SensibleAI Forecast / 2
-
Start Date: First day of data fed to SensibleAI Forecast
-
Ideal Data Points Split: calculation of data points based on the total number of data points fed to SensibleAI Forecast and the Ideal % Split
-
Ideal % Split: derived from the default cross validation strategy image at the top of the article
-
Data Point Split: Val and Test are recommended to have the same % split breakout, thus the calculated cells are the result of the total data point fed to SensibleAI Forecast minus the manually input data point counts in orange, divided by 2. The manual input cells are based on the desired data point count for train and holdout designated by the model builder.
-
% Split: calculation based on the Data Point Split / Data Points
-
Start Date (Train): Start Date of data fed to SensibleAI Forecast
-
End Date (Train): Start Date (Train) + Data Point Split (Train) - 1
-
Start Date (Val): End Date (Train) + 1
-
End Date (Val): Start Date (Val) + Data Point Split (Val) - 1
-
Start Date (Test): End Date (Val) + 1
-
End Date (Test): Start Date (Test) + Data Point Split (Test) - 1
-
Start Date (Holdout): End Date (Test) + 1
-
End Date (Holdout): Start Date (Holdout) + Data Point Split (Holdout) - 1