Cross Validation: Establishing Splits
One of the major steps in Rapid Project Experimentation (RPE) is establishing the breakouts of data that will be used for Train, Validation, Test, and Holdout for a given use case. As an architect, or anyone involved in the RPE process, it is integral to have a foundational understanding of the process to set up these data breakouts and the rationale behind each delineation. The purpose of this document is to highlight how to go about establishing the Train, Validation, Test, and Holdout sets and the important considerations one must take into account to ensure an optimal RPE setup for SensibleAI Forecast (FOR).
Definitions
-
Train Set: The split of historical data on which the models initially train and learn patterns, seasonality, and trends.
-
Validation Set: The split of historical data on which the optimal hyperparameter set is selected for each model, if applicable. A model makes predictions on the validation set time period for each hyperparameter iteration. The hyperparameter set with the best error metric when comparing predictions to the actuals in the validation set time period is selected. This split does not occur when the historical data set does not have enough data points.
-
Test Set: The split of historical data used to select the best model algorithm compared to the others. For example, an XGBoost model gets ranked higher than a baseline model based on evaluation metric score. This split does not occur when the historical data set does not have enough data points.
-
Holdout Set: The split of historical data used to simulate live performance for the model algorithms. This is the truest test of model accuracy. This set can also serve as a check for overfit models. This split does not occur when the historical data set does not have enough data points.
What should be considered when setting up data thresholds?
Amount of Historical Target Data (Total Data Points, Annual Cycles)
The amount of historical target data refers to the volume of data available for the targets you are trying to predict. It is important to note the frequency by which the source data is being provided (Daily, Weekly, Monthly) in order to understand how much historical data is needed for robust and accurate forecasting. The data thresholds native to the FOR engine indicate a need for 80 total data points to unlock multi series multivariate modeling, and 80+ train data points to unlock single series multivariate modeling. With data thresholds in consideration, it is advantageous to have enough historical data to cover at least two annual cycles in the train set in order to allow SensibleAI Forecast to learn from two occurrences of features and events and how they relate to historical data patterns.
Cross-Validation Splits
Cross-validation is the process of splitting the target dataset into multiple subsets to train, validate, test, and holdout over different periods of time. This division of data and reapplication of the train, val, test, and holdout process increases SensibleAI Forecast’s confidence and accuracy in selecting the best model for the job. The sliding scale of data volume depicted in the image below mitigates the risks of models being selected over anomalous periods of time, and reaffirms the optimal model is being selected for the entire train set of data.
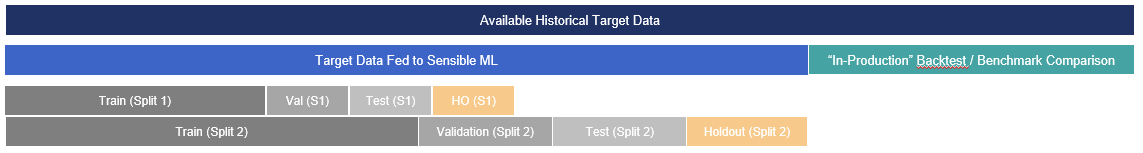
Visual of all data splits on a historical target dataset.
The cross-validation process has default settings inherent to the solution based on the number of historical datapoints provided. These default breakouts are explained in the below image:
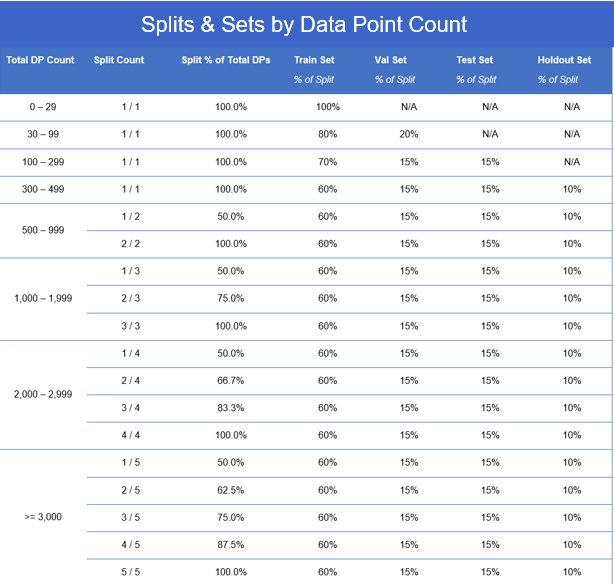
Table of datapoint counts and the types of splits generated on the data.
As the SensibleAI Forecast solution is updated, it is possible that this may become outdated over time. Always make sure to check the SensibleAI Forecast solution for the source of truth.
Initial Data Feed to FOR
The initial data feed to FOR specifies the portion of the dataset that is initially provided to the SensibleAI Forecast engine for training. It's important to determine what subset of the data will be used initially to kickstart the modeling process based on the amount of historical data provided and the relationship to the cross-validation strategy available. It's important to determine the optimal balance between having enough data to train the model effectively and extracting critical data points from the Validation, Test, and Holdout sets. Additionally, considering how many annual cycles fit into the train set by which the models can learn from is a critical step in setting up this portion of data.
In situations where there is a minimal amount of historical data present, it is important to evaluate the number of data points in the train set in relation to split delineations noted in the aforementioned cross-validation strategy. For example, if the team was provided with 998 historical daily data points, according to the image above that would create a set of data made up of two splits. The train set of data in split 2 would contain 599 datapoints (998 * .6). Considering that this is ~131 data points shy of two annual cycles (365 * 2 = 730), the team should evaluate if there is an ability to get additional data from the customer, or if it is feasible to reduce the backtest comparison period to provide additional data to FOR to train on. Additional historical data points would allow the data set to reach the 1,000-1,900 Total DP Count threshold, unlocking the third split of data and increasing the learning opportunities of FOR and the engine’s confidence in model selection. Reducing the data points in the benchmark comparison portion would also help to provide more data to FOR and create two complete annual cycles for FOR to learn on and validate feature and event correlations.
The Backtest Period for “Optimal Project Selection” (Holdout Set)
The holdout set refers to the timeframe over which historical data is reserved for evaluating the best performing model. The holdout set is not included as a part of the train, val, and test sets of data to ensure an unbiased evaluation of the model's performance on unseen data. If there are over 300 total data points, SensibleAI Forecast will automatically create a backtest period for optimal project selection. If there are under 300 total data points, the holdout set will need to be manually created based on the cross-validation threshold percentages shown above in order to properly evaluate the project performance. Upon optimal project selection, the best performing project will then be deployed into the utilization phase for benchmark comparison.
Backtest Period for Benchmark Comparison
The backtest period for benchmark comparison refers to the timeframe over which historical data is used to evaluate the performance of SensibleAI Forecast predictions against the performance of historical benchmark forecasts. This period of data is withheld from SensibleAI Forecast and acts as if the clocks were turned back to see how FOR would have performed if it were to have been adopted at that point in time. This is where the Applied AI team can reveal the accuracy lift provided by FOR over current forecasting methodologies. In general, it is crucial to maximize the comparison period to the benchmark forecast as it relates to the forecast horizon. Ideally, the comparison period would span 1 or more complete forecast horizon cycles, however, depending on how large that timeframe is, it may not be possible. If the historical data provided prohibits the comparison across an extended forecast horizon, it is advisable to work with the customer to establish a justifiable comparison period by which each stakeholder is comfortable comparing over.
Conclusion
In summary, establishing an effective data breakout strategy for Rapid Project Experimentation is foundational for successful model development and evaluation in FOR. This process involves thoughtful considerations in defining Train, Validation, Test, and Holdout sets based on things like historical data thresholds, cross-validation splits, and backtest periods. Key factors to consider include the volume and frequency of historical data and ensuring coverage of multiple annual cycles within the training data. Establishing robust holdout and benchmark comparison periods is also critical for unbiased model assessment and validation against historical benchmarks. By leveraging these strategies and aligning them with specific use case requirements, stakeholders can enhance model accuracy, confidence, and ultimately drive impactful decision-making through the use of FOR.