Dimensional Aggregation - Deployed Model Forecast
A commonality among all SensibleAI Forecast use cases is the need for accuracy evaluation at the dimensionality by which the business currently forecasts (summarized level). With that being said, SensibleAI Forecast provides users the flexibility to forecast at varying levels of dimensionality which can lead to a mismatch between the granularity of the forecast output, and the granularity of the accuracy to be evaluated. In situations like this, there is a need to perform dimensional aggregation to ensure an equitable accuracy comparison among available forecasts.
Please check out Evaluation vs. Summarization Accuracy for a breakdown between the two concepts of “Evaluation” accuracy level versus the “Summarized” accuracy.
Dimensional Aggregation Explained
Simply put, dimensional aggregation refers to utilizing aggregation queries to eliminate target dimensions until the dimensional depth is equal between the forecasts being compared. For example, if the customer benchmark forecast is submitted at the Country~Store level, and the SensibleAI Forecast forecast is output at the Country~Store~Department level, there is a mismatch in the evaluation dimensionality between the two forecasts. In this case, the SensibleAI Forecast power user would need to ensure the forecasts are being compared at the same dimensionality. To do that, the power user would write a SQL query that would aggregate out the department dimension, sum the value dimension, and then create dimensionally equitable forecasts at the Country~Store level.
As of Jul 29, 2025, the Forecast Value Add solution allows for the ability to do dimensional aggregation on-the-fly when conducting accuracy analysis.
Important Information to Include in Dimensional Aggregation
To start, it is first important to understand what information the user would be interacting with as a part of this exercise. After a model has been deployed, and the forecasts and target data set updates are complete, the user may want to evaluate the performance of those predictions and can export a consumption group called a Deployed Model Forecast Table.
Deployed Model Forecast Table
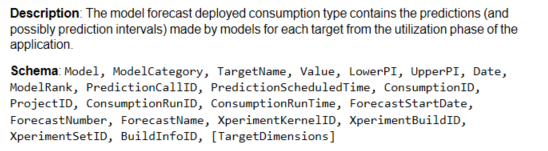
With an understanding of the Deployed Model Forecast Table, the user will decide which target dimensions they are intending to aggregate out, and which data needs to remain included in the resulting table. When aggregating in SQL, the most common aggregate function is the Sum() function. In a dimensional aggregation situation, the user will use the Sum() function to uplevel the target dimensionality view and apply the Sum() on the value column. When using an aggregate function, it is critical to understand the columns necessary to execute a proper aggregation. Considering the image above outlining the schema of the Deployed Model Forecast Table, the user will want to exclude columns that associate any distinction to the lower target dimension or can create instances of duplicate records once the lower target dimension has been eliminated. Once the necessary columns have been selected, the user must also ensure that all columns that are not part of the aggregate Sum() function are listed in the GROUP BY clause if they are not being aggregated.
Dimensional Aggregation Example
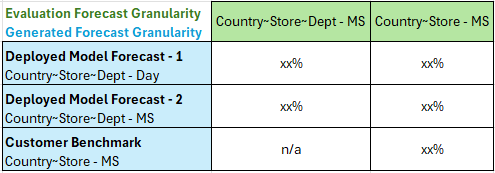
Considering the table above, to properly compare Forecast 1, Forecast 2, and the Customer Benchmark, the user will have to perform resampling and dimensionally aggregate to create an apples-to-apples comparison among all forecasts.
Starting with Forecast 1, the forecast was generated at the Country~Store~Department dimension and at a daily granularity. To compare to a Country~Store Benchmark at the MS granularity, the user would have to resample the Deployed Model Forecast table from D to MS, then aggregate out the department dimension ensuring to exclude any columns relating to the department dimension and/or creating duplicate intersections once department has been removed. For Forecast 2, the user would not have to resample as the forecast was already generated at the MS level, however, the same dimensional aggregation described for Forecast 1 would need to occur to up level to the Country~Store dimensionality. Once these steps have been executed, the user is able to conduct a fair comparison at the same evaluation granularity and assess the accuracy lift provided by SensibleAI Forecast.
Summary
In summary, when using SensibleAI Forecast, it is critical to evaluate accuracy at the same dimensionality as the customer benchmark forecasts. When a user is creating forecasts with varying target dimensions, it can create a disparity between the granularity of the forecast outputs and the benchmark forecast. In these cases, dimensional aggregation is necessary to eliminate target dimensions until the compared forecasts match in depth, thus ensuring a fair accuracy evaluation comparison among forecasts.