Incorporating Features: FRED
Why Should You Care?
The St. Louis Federal Reserve's database, FRED, is an invaluable tool for accessing US economic data. It's managed by the Federal Reserve Bank of St. Louis and offers over 765,000 data series from various sources like government departments, international organizations, and the private sector. This database is rich with diverse data types including interest rates, employment figures, GDP, and more; all accessible for free at Federal Reserve Economic Data | FRED | St. Louis Fed. The data, often updated monthly, spans decades, providing a comprehensive view of nearly every industry, market, or government entity in the US.
I wrote a separate article (Using the Feature Library's Stock Generator) where I advised against using FRED for what I thought to be some valid points, namely, that accessing this data requires manual intervention and otherwise interrupts the automated process of creating new forecasts. However, there artons of data sets that are inaccessible otherwise from the data library, which means that sometimes there is no other choice.
FRED's vast US econometric data and the customization offered through a FRED account—like custom dashboards—provide a straightforward, efficient means for users to incorporate external data into their analyses.
Searching for Features
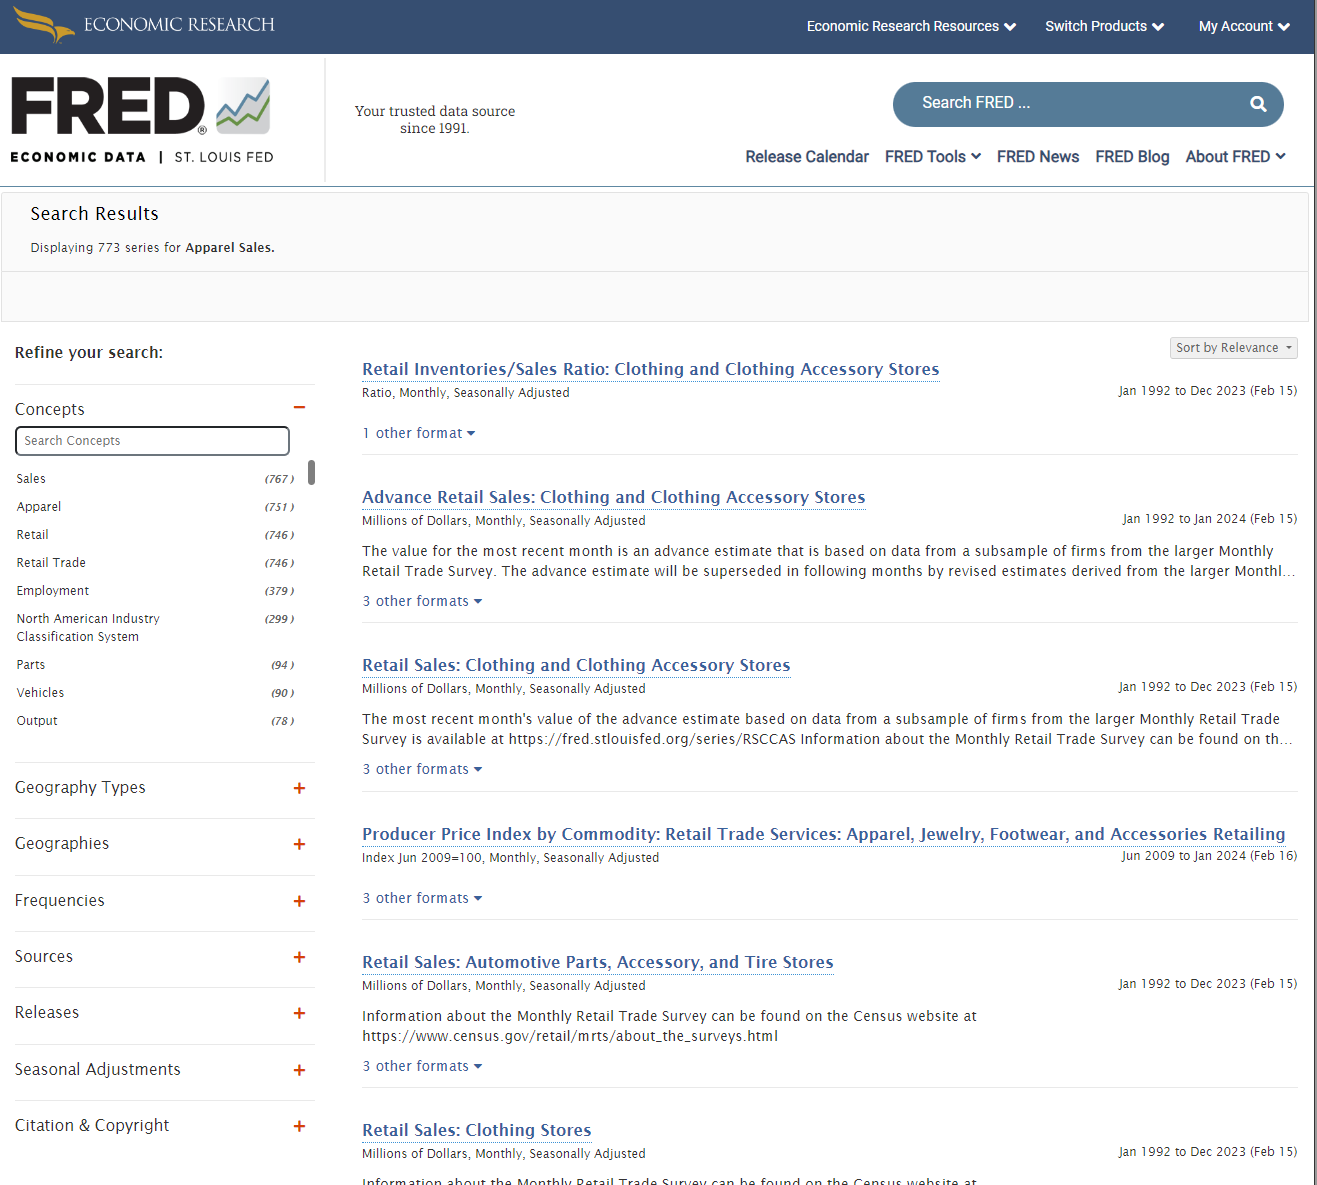
FRED's homepage features a search bar where users can input keywords to find relevant data series, sorted by relevance. For instance, a search for "Apparel Sales" might yield data relevant to a clothing manufacturer. Each dataset includes details on the metric units, granularity, and time span, ensuring users find up-to-date data covering their desired period. Filters on the left allow for refining searches by concepts, geography, and frequency.
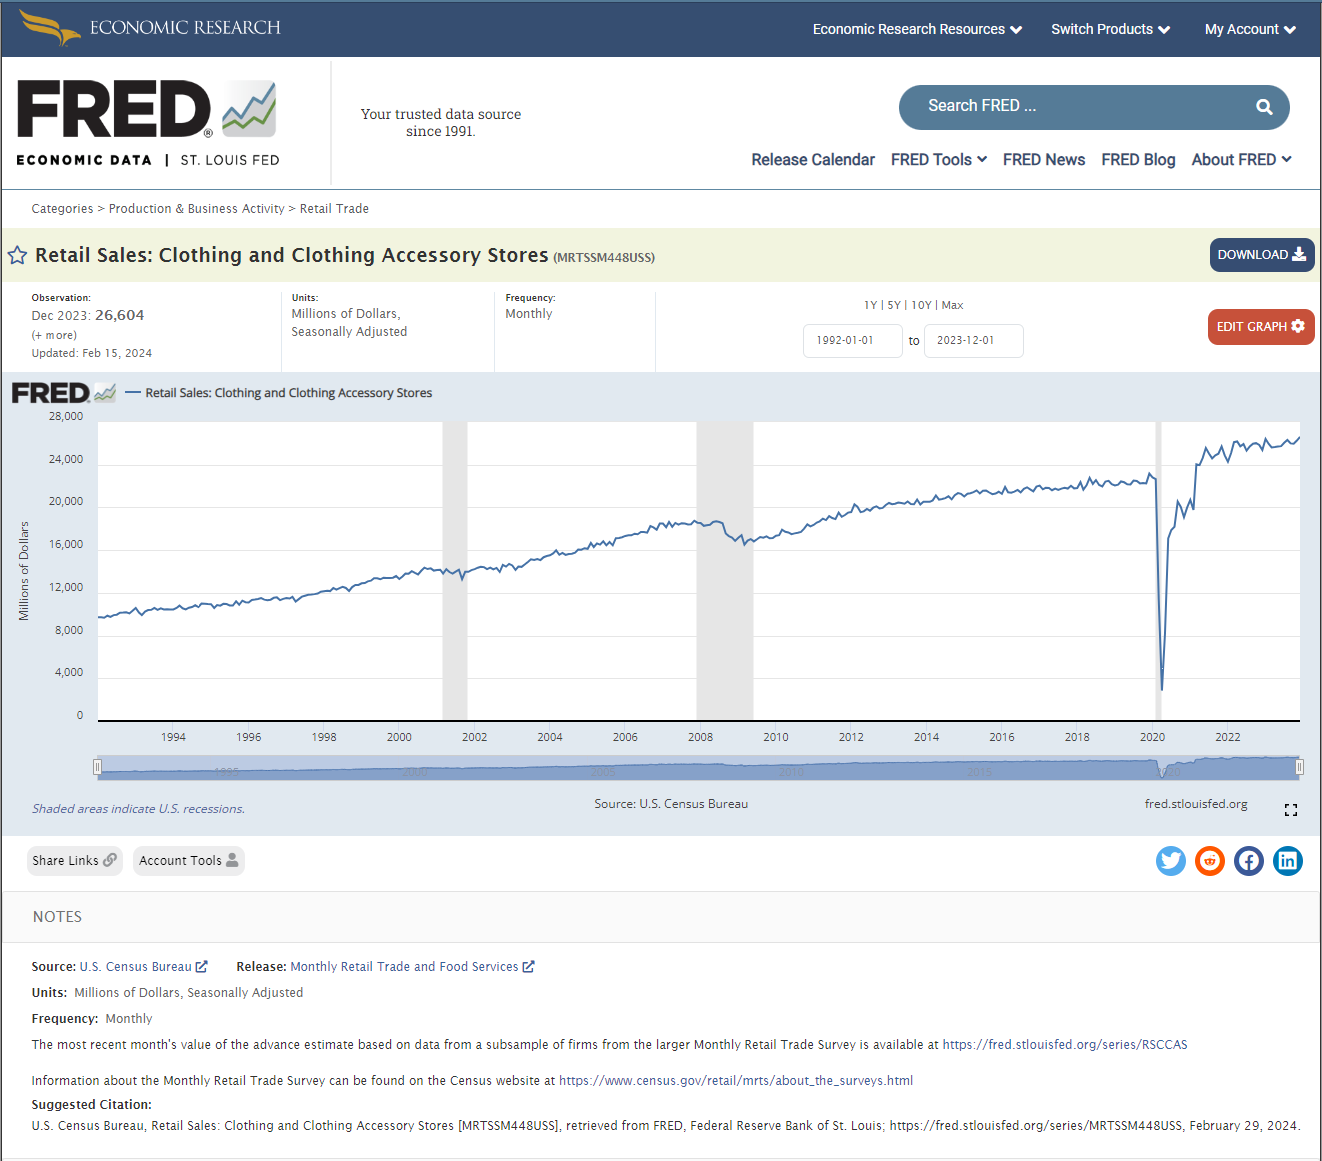
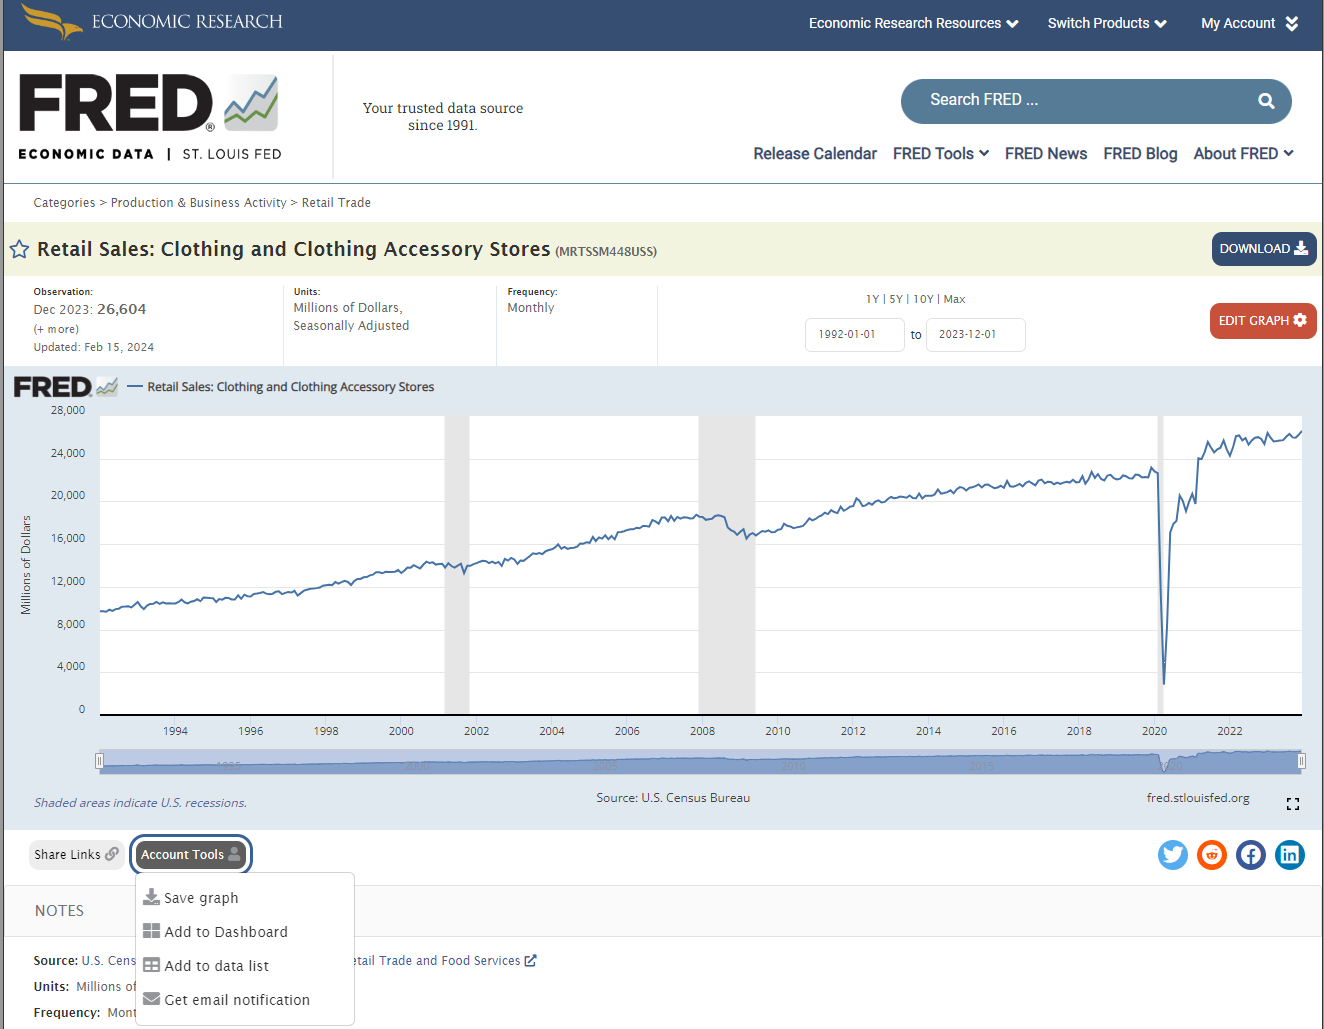
After selecting a dataset, users can view data and notes for a comprehensive understanding. Important to note is the unique identifier (e.g., MRTSSM448USS) found in the dataset's URL, which simplifies data retrieval:
https://fred.stlouisfed.org/series/[Dataset Identifier]
To download, adjust the time range above the graph, select "download," and choose the CSV format. This format suits AISDMA uploads, although it requires slight modifications to align with SensibleAI Forecast's format.
CSV Extracts
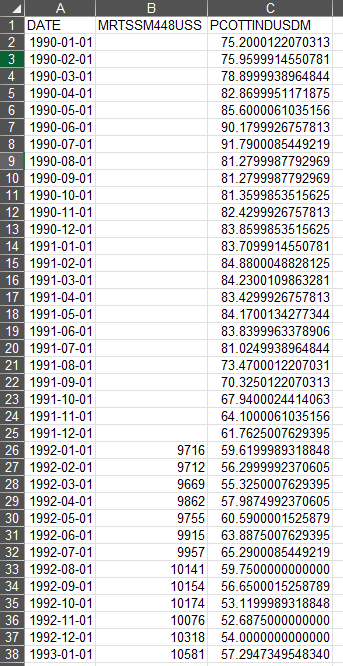
CSV files are named after the Dataset Identifier code and include two columns: the date and the dataset's numerical values. Note how the column name of the values is the Dataset Identifier code.

For SensibleAI Forecast compatibility, a "Feature Name" column should be added, and the value column renamed. This is a straightforward, yet manual process. I typically prefer to use the plain text feature name as the feature for faster understanding of SensibleAI Forecast Feature Interpretability and Insights.

When using multiple FRED datasets, it's efficient to combine them into one file, grouping similar features based on their impact (e.g., production vs. demand) or measurement focus. Repeat the above process for each FRED feature, and then copy and paste the data to the end of another’s feature data. In this example, I pasted the “PPI: Cotton” feature at the end of the “Retail Stores: Clothing” feature.

A recommendation for file and column naming conventions are as follows:
-
Create a feature file that groups similar features together. What constitutes a group is up to the implementors discretion and depends on the engagement.
- If features should map to targets at different dimensionalities, they should be in different groups.
- Features that affect production should be in a separate file than features that impact demand (as these may in the future be mapped to different target dimensions).
- Features can be grouped based on what they measure. Datasets that measure PPIs of different materials may be grouped together, while datasets that measure government spending across categories may be stored in a different file.
-
The Feature Name column should be named uniquely across all features. One way to ensure this is to name that column according to its grouping strategy. In the above pictured example, I might want to rename “SeriesName” to “ClothingFeatures”.
-
If you choose to use an English description of the series rather than its code, document the EXACT series name with its code somewhere. This is so the dataset can be easily retrieved in the future. There are many datasets on FRED with similar names.
Data Lists
Extracting and formatting multiple datasets for SensibleAI Forecast can be a time-consuming task. However, FRED's "Data List" feature streamlines this process significantly. It allows users to compile multiple datasets into custom lists for simultaneous extraction.
To use this feature:
- Create a FRED Account: Begin by signing up with FRED.
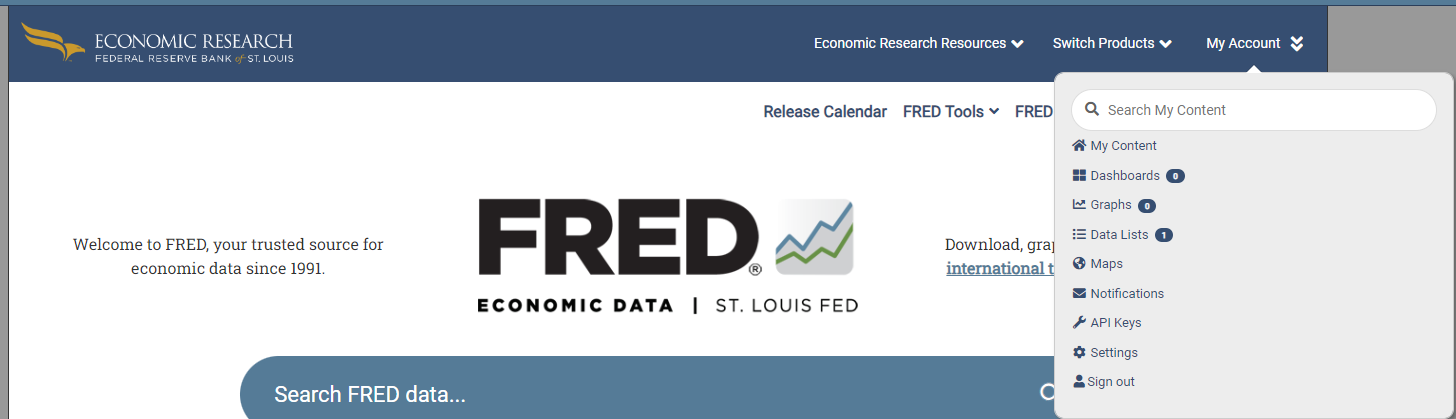
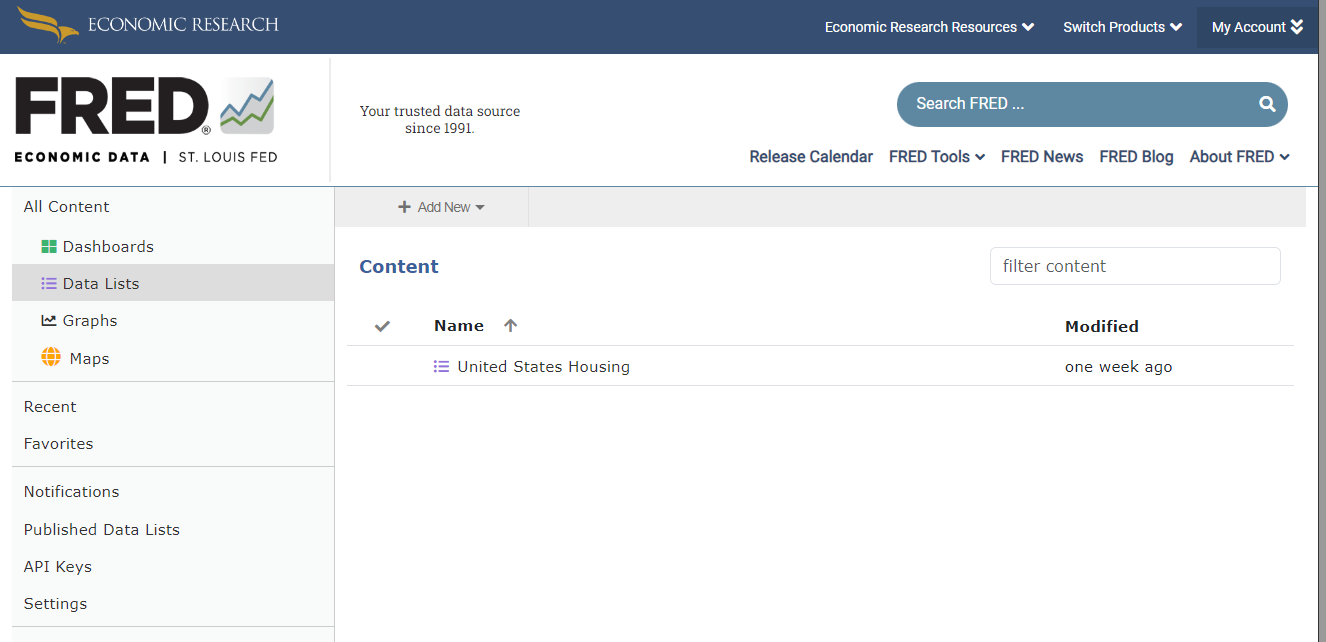
- Navigate to Data Lists: Access this by selecting 'My Account' and then 'Data Lists'. Here, you can view existing lists or create new ones.
- Create a New Data List: Click on 'Add New' to start a list tailored to specific needs, such as a clothing retail analysis.
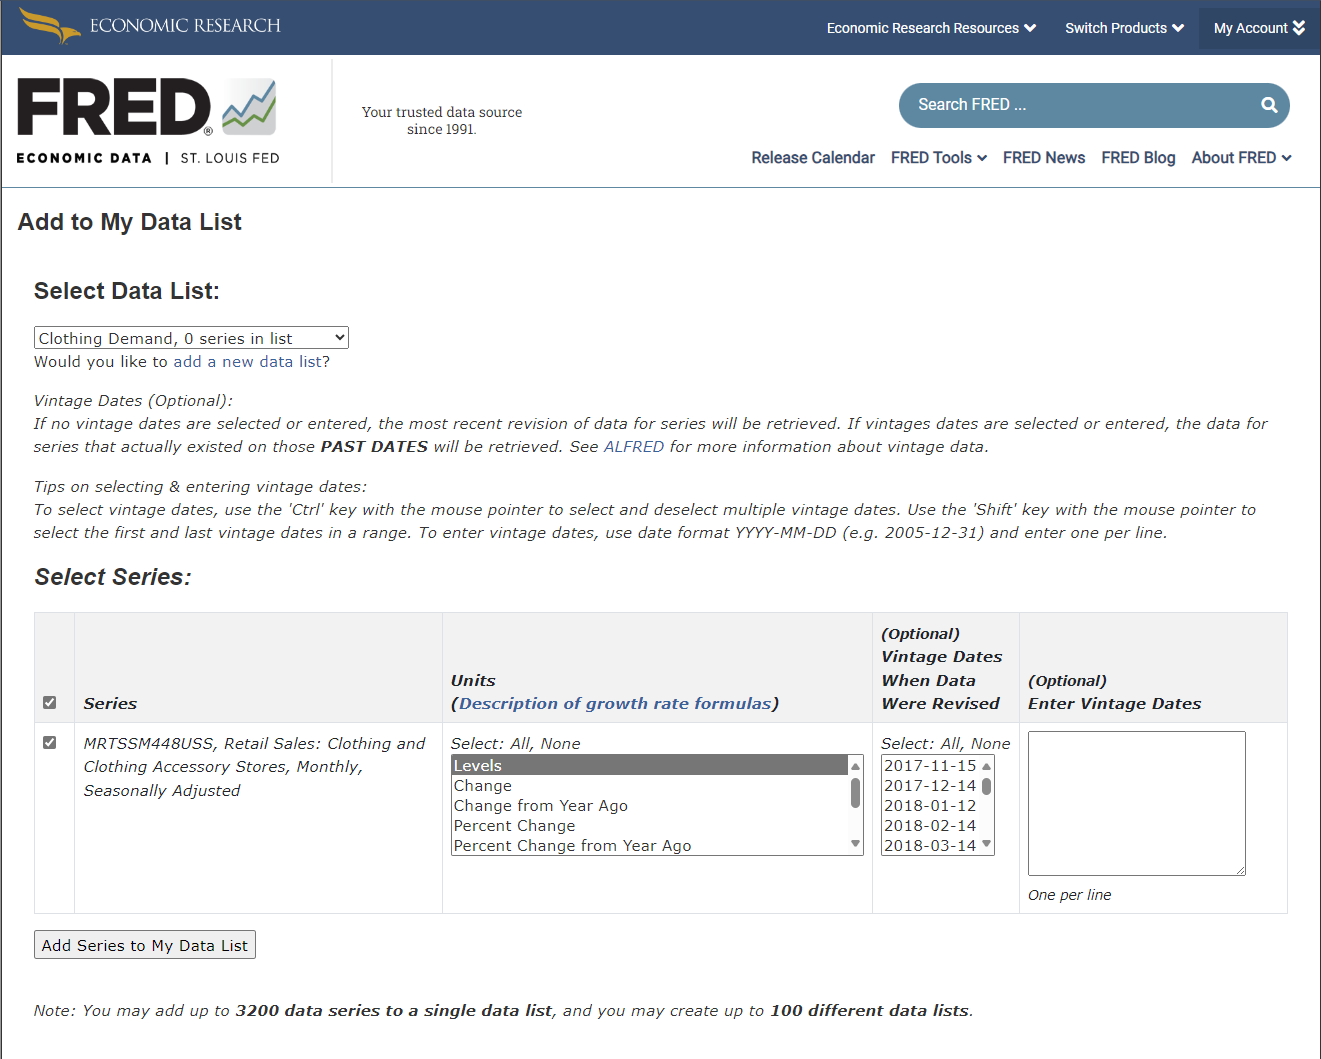
- Populate Your Data List: Search for relevant datasets on the FRED homepage. For example, when you find the Retail Sales dataset for clothing, use the 'Account Tools' dropdown to add it to your data list. You'll need to specify the list, the dataset, and the units of measurement, which can range from levels to rates of change.
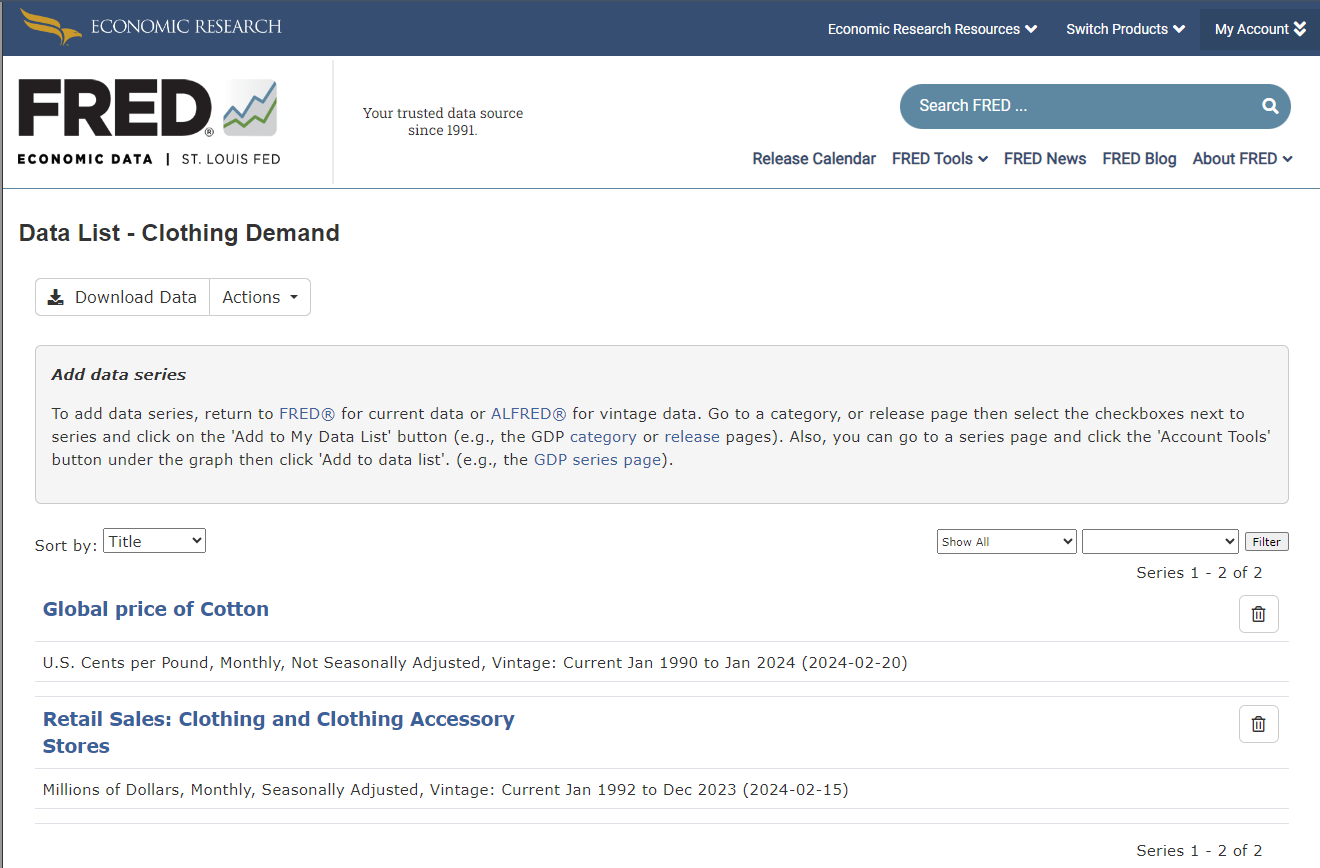
- Repeat for Additional Datasets: You can add up to 3,200 series to each list, with a maximum of 100 lists per account.
Accessing Your Data:
To download, navigate back to your data lists, select the desired list, and hit 'Download Data'. Choose your date range and format (Zipped Excel is recommended).
The downloaded file will include a summary sheet and a detailed dataset sheet, which you can adapt for SensibleAI Forecast use, similar to the CSV Extracts process. Notice how if one set doesn’t have data at the stated date, the entry will be blank.
Suggested Data Update Method
To efficiently update your project with the latest data:
-
Maintain a Comprehensive FRED Data List for all relevant features.
-
Monthly Downloads: Instruct clients to download the updated list each month, starting from two years prior to the beginning of your source data.
-
Prepare the Data: Save the detailed dataset sheet as a CSV and upload it into DMA, including the [Download Date] in the table name.
-
Automate Formatting: Utilize a business rule to convert the DMA upload into the required SensibleAI Forecast format.
- Ensure the DMA upload table name is an input parameter to the data sequence.
- Automate feature mapping if needed.
This approach minimizes manual intervention, making the process more straightforward and less prone to errors compared to manual file formatting, which can be cumbersome, and risk being neglected during forecasting cycles.
Conclusion
In conclusion, leveraging the St. Louis Federal Reserve's FRED database offers an unparalleled advantage for forecasting. With its extensive repository of over 765,000 data series, FRED simplifies access to US economic metrics. Its "Data List" feature further enhances efficiency, allowing users to curate and extract multiple datasets simultaneously for streamlined analysis. This process, crucial for adapting data to SensibleAI Forecast formats, becomes significantly less time-consuming, enabling analysts to focus on deriving actionable insights rather than data management tasks.
The proposed method for updating data ensures that analysts can maintain the continuity and relevance of their datasets with minimal effort. By creating comprehensive data lists and utilizing automated processes for formatting and updating, the integration of FRED data into forecasting models becomes a seamless part of the workflow. This approach not only saves time but also reduces the potential for errors, ensuring that the forecasting models remain robust and reliable.