Incorporating Features: Feature Library Stock Generator
Why do I Care?
It should be clear to everyone that including feature data in the model building process is critical. Not only do we typically see accuracy improvements, but it also serves to the Insights pillar of SensibleAI Forecast’s value. It’s a powerful statement to see the utilization percentages or feature impact scores of macroeconomic drivers that business planners can relate to.
The Efficiency pillar of SensibleAI Forecast preaches the automation of data collection and cleaning, which is something that the Feature Library solves. Not only can it eliminate a US-centric feature set dependency, but it leverages pre-built data connections. It can be used for much more company stock prices and has the potential to eliminate external data sources for macroeconomic indicators as well as diversifying the geographical base of features.
About the API
When we enter a ticker in the configuration window for the stock feature, SensibleAI Forecast queries the Financial Modeling Prep (FMP) engine to first validate if the ticker is an acceptable entry, and then later to pull in historical data to populate the feature set. FMP is a free API that anyone can use to pull an astounding amount of information about publicly traded companies globally. We barely scratch the surface of this tool’s capability by pulling trading prices.
The most important resource is the API documentation (Free Stock Market API and Financial Statements API - FMP API (financialmodelingprep.com)). While everything that I note here can be found or implied in the documentation, I believe I’ve compiled a relevant summary on a single question: What is an acceptable ticker?
For those code-savvy enough, you can sign up to receive a free API key (required for every API call) so that you can query FMP in a sandbox code environment. You can “ask” FMP all sorts of things, such as for a list of valid inputs, returning the output in JSON format. The neat thing is you can do this in code, or by visiting a specific URL. For example, visiting:
https://financialmodelingprep.com/api/v3/etf/list?apikey=[Enter Your API Key Here]
will return a complete list of acceptable ETFs (more on that later) we can use as a valid ticker.
We recommend querying via Python, as it handles JSON very well, allowing you to automate and clean the returned data. The documentation gives you the exact URLs to query in order to return specific items.
Acceptable Tickers
Here’s a list of valid inputs (or tickers) that we can pull from this API. I’ll give a brief overview of what each item means, and in following sections, I’ll explain when we might consider these, how to use them, and how to look them up on the API.
Company Stock Tickers
This is what we’re all familiar with using. By entering the symbol for a company, we can incorporate that stock’s historical trading price.
Stocks or Funds on Other Exchanges
We can also include stocks traded on other exchanges. For example, Louis Vuitton is a publicly traded company, but only on the Euronext exchange in Europe. We can specify stocks that might have a duplicate ticker symbol to a US-traded company, but only exist on international exchanges.
Exchange Traded Funds (ETFs)
An ETF is a type of investment fund that pools money from many investors to purchase a diversified portfolio of stocks, bonds, or other securities. ETFs are traded on stock exchanges, much like individual stocks, and their price fluctuates throughout the trading day. They offer investors an easy way to gain broad exposure to entire market indices, sectors, or other asset classes, often with lower expense ratios compared to traditional mutual funds.
Indexes (and Treasury Yields)
Indexes are a statistical measure that represent the performance of a group of assets or a segment of the financial market. It is essentially a benchmark, used to track the performance and health of a particular sector, such as the stock market, bond market, or another asset class. Indexes are calculated from the prices of selected assets (e.g., stocks or bonds) and provide a summary measure that reflects the overall market or a specific part of it. Examples include the S&P 500, which represents 500 of the largest U.S. publicly traded companies.
Forex Rates
A forex rate, or foreign exchange rate, is the value at which one currency can be exchanged for another. It is influenced by economic indicators, geopolitical stability, and market speculation. Forex rates are crucial for international trade, investment, and travel.
Commodities
Commodity prices represent the market value of raw materials and agricultural products, determined by supply and demand. These prices fluctuate due to factors like weather, geopolitical events, and economic policies, impacting global economies by affecting inflation, trade balances, and monetary strategies. Commodities include metals, energy, and agricultural products, traded on specialized exchanges.
Cryptocurrencies
Cryptocurrency is a digital or virtual form of currency that uses cryptography for security, making it difficult to counterfeit. Operating on decentralized blockchain technology, it enables secure, peer-to-peer transactions without the need for intermediaries like banks. Popular examples include Bitcoin and Ethereum, with values fluctuating based on market demand.
Company Stock Tickers
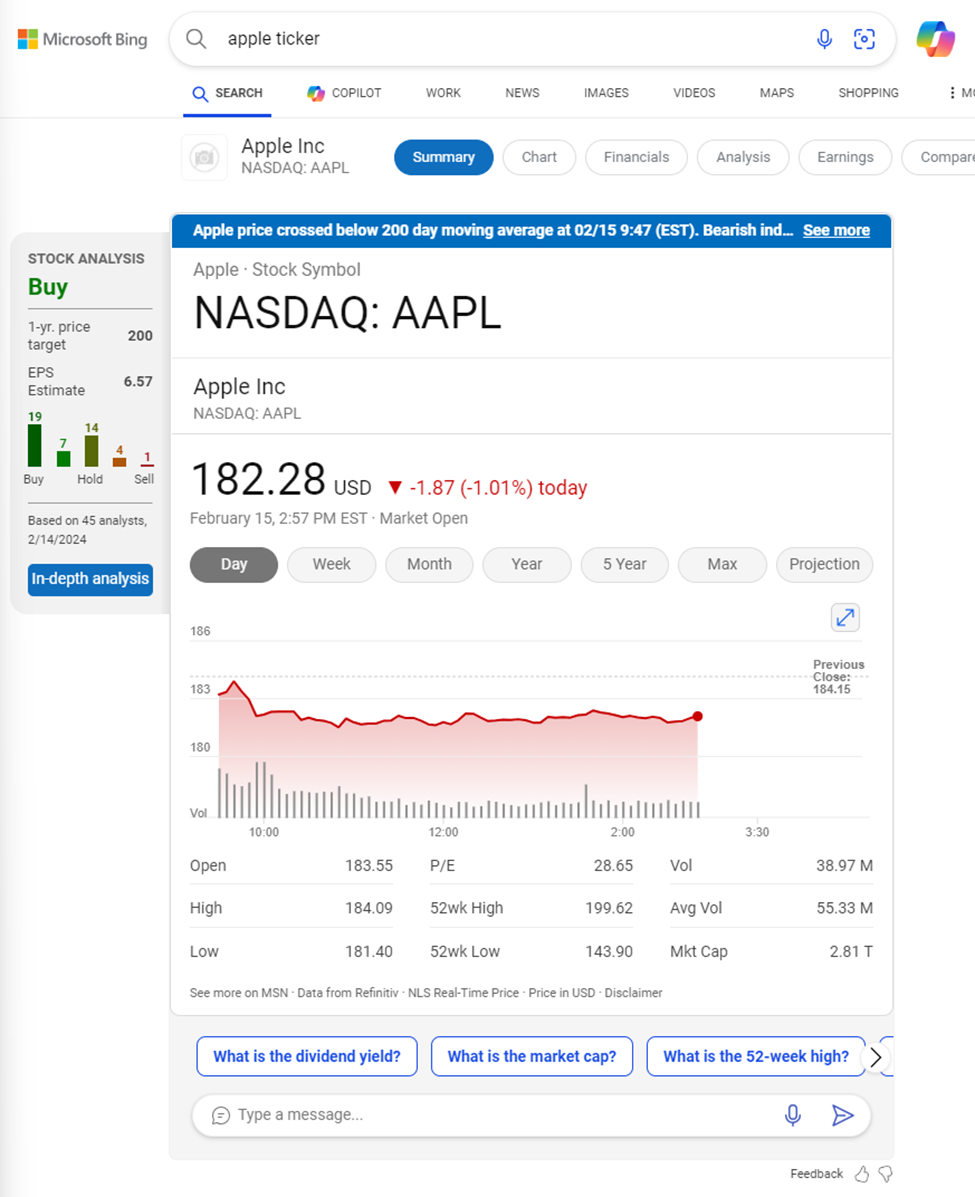
Pretty much any ticker of any publicly traded company is accepted by the API. To find the ticker of a company, we can Google search “[Company Name] ticker” and the first result of should tell us the name. For example, to find the ticker of Apple, we can search “Apple ticker” and the first result shows it’s AAPL, as well as trades on the NASDAQ exchange (keep this in mind for the international exchanges section).
We can find a list of all accepted symbols (tickers) at the endpoint:
https://financialmodelingprep.com/api/v3/stock/list?apikey=[Enter your API Key]
A snippet of that file is shown below. This is a JSON formatted file and is a list of all acceptable symbols. To interpret the meaning, all items between brackets belong to the same group. “TVE” is the ticker of the Tennessee Valley Authority PARRS A 2029 stock, and is traded on the NYSE. Similarly, ESGRO is also an accepted ticker input and reflects the stock for Enstar Group Limited.
  {
    "symbol": "TVE",
    "name": "Tennessee Valley Authority PARRS A 2029",
    "price": 21.82,
    "exchange": "New York Stock Exchange",
    "exchangeShortName": "NYSE",
    "type": "stock"
  },
  {
    "symbol": "ESGRO",
    "name": "Enstar Group Limited",
    "price": 24.78,
    "exchange": "NASDAQ Global Select",
    "exchangeShortName": "NASDAQ",
    "type": "stock"
  },
By opening up this text document and Ctrl+F searching for a ticker or company name, we can see how we need to enter the ticker for the API to accept it.
Stocks or Funds on Other Exchanges
We can include stocks or funds traded on other exchanges. As an example, Louis Vuitton (LVMH) is a French publicly traded company, but not on any exchanges in the United States (think NYSE, NASDAQ). Rather, LVMH’s stocks are traded on the Euronext exchange in Paris. To incorporate Louis Vuitton’s stock price in our models, we must include the ticker “MC.PA”.
Note how there is a period in the ticker. The first half, “MC”, is the stock name, while the second half, “PA” indicates the exchange it trades on. Any stock not on an American exchange must include the exchange suffix in its ticker.
Example exchange suffixes include:
- L - London Stock Exchange
- DE - Frankfurt Stock Exchange
- PA - Euronext Paris
- BR - Euronext Brussels
- BO - Bombay Stock Exchange
- HK - Hong Kong Stock Exchange
- SA - Sao Paulo Exchange
It can be a bit tricky finding the exchange suffix for specific company, as there’s no global standardization, and it’s made more complex when a single company and its divisions are traded on multiple international exchanges.
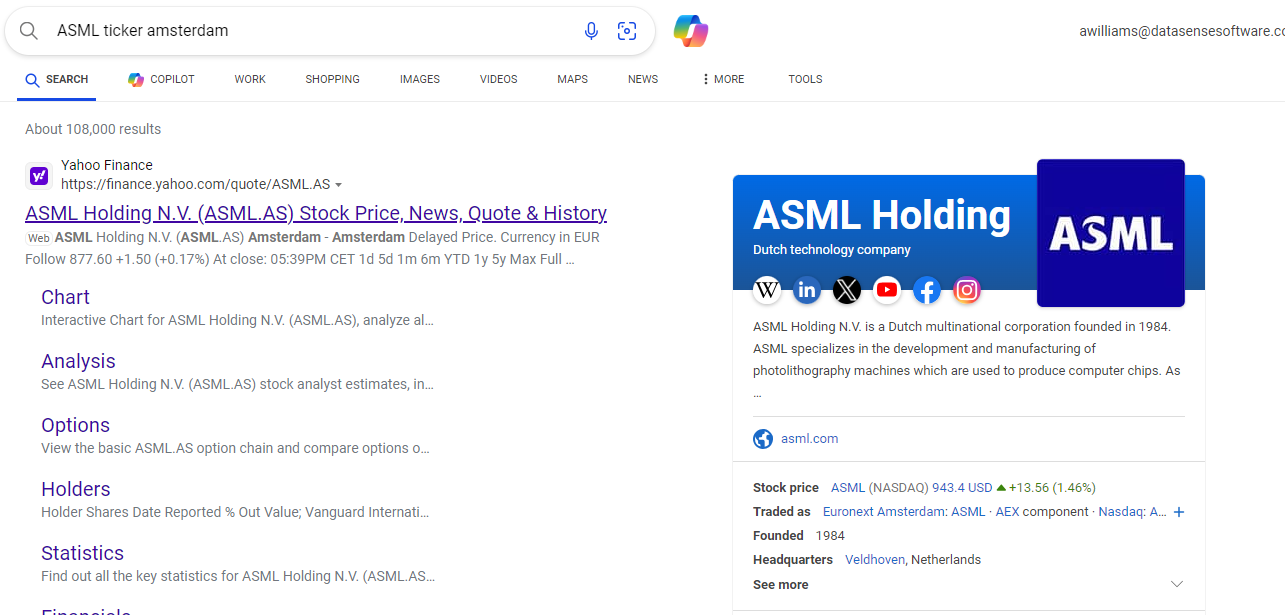
Typically, the easiest route is to search for the company ticker online, note its ticker and exchange, and then cross reference it with the list of symbols from FMP. For example, we search ASML ticker Amsterdam” on Google, note that it’s traded on the Euronext Amsterdam exchange under "ASML", and then look it up on API returned list.
  {
    "symbol": "ASML",
    "name": "ASML Holding N.V.",
    "price": 930.195,
    "exchange": "NASDAQ Global Select",
    "exchangeShortName": "NASDAQ",
    "type": "stock"
  },
    {
    "symbol": "ASML.AS",
    "name": "ASML Holding N.V.",
    "price": 872.4,
    "exchange": "Amsterdam",
    "exchangeShortName": "EURONEXT",
    "type": "stock"
  },
    {
    "symbol": "ASME.DE",
    "name": "ASML Holding N.V.",
    "price": 873.5,
    "exchange": "Frankfurt Stock Exchange",
    "exchangeShortName": "XETRA",
    "type": "stock"
  },
It is important to note that ASML is traded on multiple exchanges under different currencies, so we have agency to choose which valuation we care about, likely dependent on which division or region we are focusing on in the engagement.
Exchange Traded Funds
Unlike stocks, ETFs are generally tied to a specific sector. These can be appealing to use over a specific company since demand is likely to be correlated with the performance of a market segment, rather than a specific company. Unless a company is intertwined with its competitor (a clear duopoly) or heavily relies on a key partner for a large percentage of its orders, it may be advisable to use a suitable ETF, rather than company tickers.
We can find a list of all accepted ETF symbols at the endpoint:
https://financialmodelingprep.com/api/v3/etf/list?apikey=[Enter your API Key]
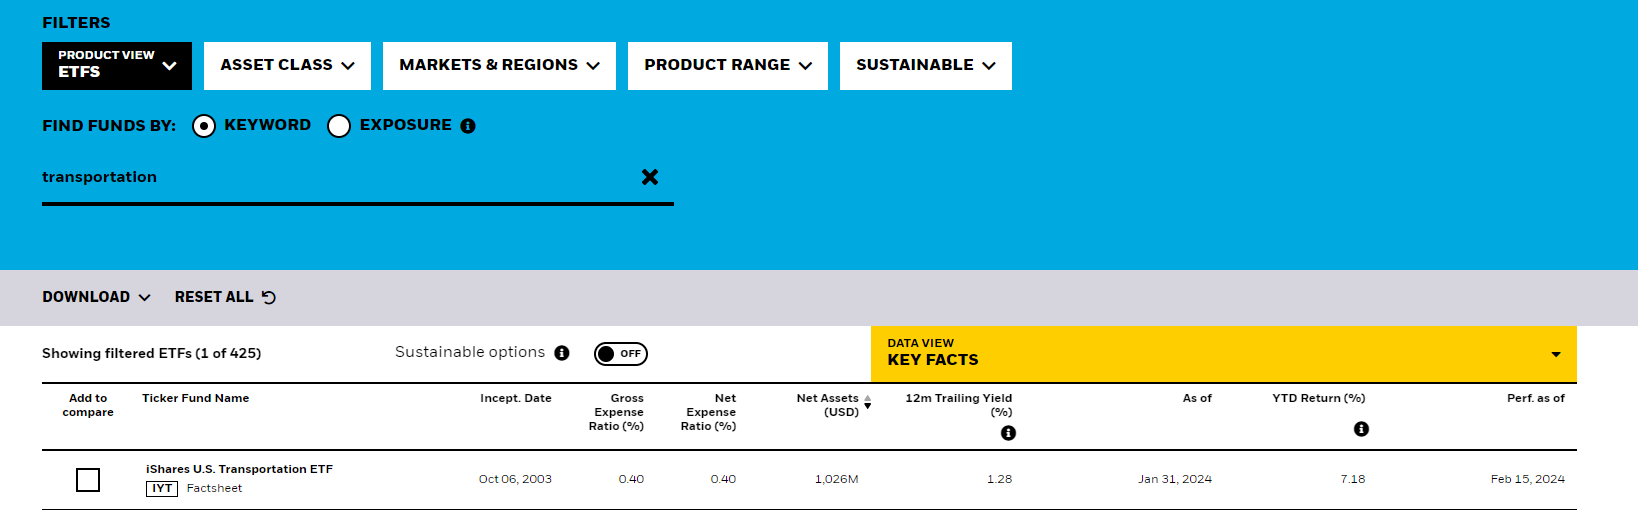
Furthermore, I’d like to share some additional resources on how to find specific ETFs. A specific resource we like to use is the Find iShares Funds tool from iShares. iShares ETF Investments List | iShares - BlackRock. On this website, we can look up ETFs of various asset classes, regions, and product ranges, and further examine those of interest to understand what specifically it tries to track.
For example, if we have a client in the railroad industry, we might want to include some metric on the health of the transportation industry, By searching for “transportation”, we can identify that iShares offers the something that we might want to use, under the ticker “IYT”.
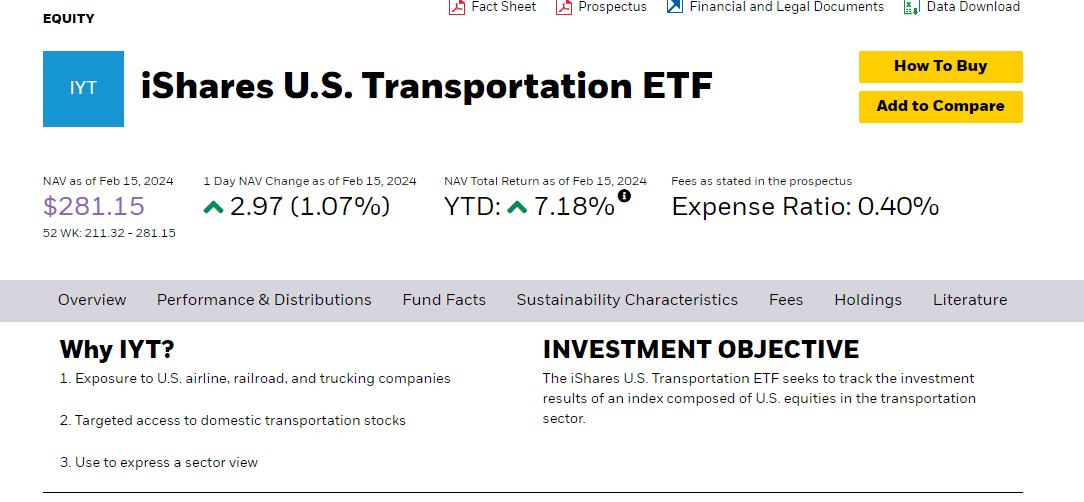
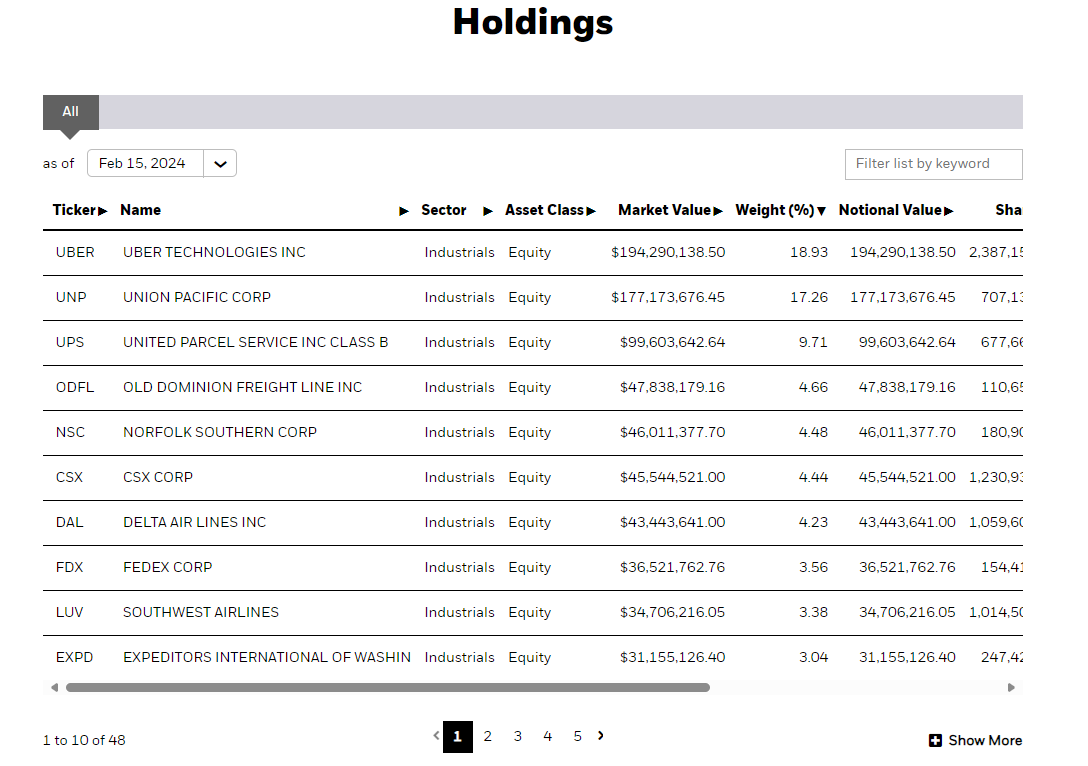
If we click into the offering, we can see an objective statement to see what it tracks, alongside a list of holdings so we can confirm that it is exactly what we’re interested in.
Finally, we want to cross reference this with the FMP API to confirm IYT is an acceptable ticker. Searching the extract, we can see that we’ll be able to use this as a feature.
  {
    "symbol": "IYT",
    "name": "iShares Transportation Average ETF",
    "price": 279.28,
    "exchange": "BATS",
    "exchangeShortName": "ETF",
    "type": "etf"
  },
A final note on using the iShares ETF search is that all ETFs listed will primarily be composed of companies based in the United States. It is advisable to use other search avenues to find funds for sectors and markets in other countries. For example, iShares has a separate ETF search for funds traded on the London Stock Exchange and many Euronext exchanges under the iShares ETF and Index Investments List | iShares BlackRock website.
Indexes (and Treasury Yields)
Now we enter a world of financial measures beyond traditional stocks we can buy or sell on an exchange. This Stock API allows us to enter a “ticker” for an index. Indices are a statistical measure that represents the performance of a group of assets or a segment of the financial market. It is essentially a benchmark, used to track the performance and health of a particular sector, such as the stock market, bond market, or another asset class. Indexes are calculated from the prices of selected assets (e.g., stocks or bonds) and provide a summary measure that reflects the overall market or a specific part of it.
Indices differ from ETFs slightly. While an index measures market segments' performance, i.e., an abstract benchmark, an ETF are actively traded and under management. Therefore, it might be preferable to use indices over ETFs if available, but many times, ETFs can be more diverse in what they track.
Examples include:
- Dow Jones Industrial Average - 30 large companies in the US Industrial sector
- FTSE 100 - 100 largest companies in the London Stock Exchange
- Nikkei 225 - 225 largest companies on the Tokyo Stock Exchange
- Bovespa Index - 60 largest companies in Brazil’s stock market
- JSE Top 60 - 40 largest companies on South Africa’s stock market
These examples look at overall markets in countries, but it is important to note that many indexes exist for specific sectors in regions, such as the STOXX 600 Food and Beverage, which breaks down the 600 largest European companies in the Food and Beverage sphere.
We can find a list of all accepted index symbols at the endpoint:
https://financialmodelingprep.com/api/v3/symbol/available-indexes?apikey=[Enter your API Key]
Again, Google is our friend in finding what indexes exist. We can cross reference those indexes on the list, such as the S&P 500 index, which uses “^SP500TR” as its ticker.
  {
    "symbol": "^SP500TR",
    "name": "S&P 500 (TR)",
    "currency": "USD",
    "stockExchange": "SNP",
    "exchangeShortName": "INDEX"
  },
Finally, we can also include US Treasury Yields, which are a measure of the risk-free interest in US markets and typically correlate with investor sentiment towards economic expectations and heavily influence interest rates across the economy. These can also be found on the list of indexes offered by FMP.
As an example, we can use the ticker “^TYX” to incorporate the 30-year US Treasury Yield.
Forex Rates
Forex, or foreign exchange rates reflect the value of one currency in terms of another currency. As these rates fluctuate in response to various political and economic factors of two countries, incorporating these rates can allow models to learn from international factors.
For example, when a country’s currency falls, consumers from other countries will buy more from that country, as their foreign currency can purchase goods from the cheaper country. Similarly, producers might route more production to that country, as labor and materials will tend to be cheaper. Thus, we see how forex rates can affect both production planning and demand planning.
Typically, the ticker for a forex pair will be a six-character code, with the first three symbols being the abbreviation of the target currency and the last three being the abbreviation of the base currency. For example, “EURUSD” will be the price of the Euro in US Dollars, floating around $1.10.
Take care to observe what the names of the currencies of certain countries. Take China, whose currency is the Renminbi (RMB), but is named the Chinese Yuan (CNY) on international markets. Therefore, while we can find RMBUSD rates online, the API only acknowledges CNYUSD.
We can find a list of all accepted forex pairs at the endpoint:
https://financialmodelingprep.com/api/v3/symbol/available-forex-currency-pairs?apikey=[Enter your API Key]
Commodities
We can also include the prices of various commodities on the global market in US dollars. While typical commodities are represented (crude oil, wheat, gold, lumber), there are some exotic options as well – palladium, cocoa, soybeans, etc.
This is a great way to incorporate material prices if a client doesn’t track that internally, without having to rely on an external database like FRED.
We can find a list of all accepted commodities at the endpoint:
https://financialmodelingprep.com/api/v3/symbol/available-commodities?apikey=[Enter your API Key]
As this list is quite smaller than the ETFs, indexes, or Forex pairs, it is recommended to read through the list to find items of interest to incorporate.
Cryptocurrencies
Cryptocurrency is a digital or virtual form of currency that uses cryptography for security, making it difficult to counterfeit. Operating on decentralized blockchain technology, it enables secure, peer-to-peer transactions without the need for intermediaries like banks. Popular examples include Bitcoin and Ethereum, with values fluctuating based on market demand.
While cryptocurrency has traditionally been used as a speculative asset, one might find it price history useful when dealing with a company who is in a digital space, or publicly has interaction with the “blockchain”. While the price of crypto might not directly influence demand, it might serve as an indirect way of measuring publicity, marketing hype, engagement, or funding.
Cryptocurrency prices can be used in an identical fashion as the Forex rates, but will only be expressed in terms of USD, and might have 3-5 characters for the Crypto symbol, rather than 3. “BTCUSD” will reflect the price of a bitcoin in US Dollars.
You can find a list of all accepted cryptocurrencies at the endpoint:
https://financialmodelingprep.com/api/v3/symbol/available-cryptocurrencies?apikey=[Enter your API Key]
Other Resources
There’s a couple of other useful tools offered by the API. First is a list of Stock Peers. By querying against a specific ticker, the FMP Stock Peers endpoint provides a group of companies that trade on the same exchange, are in the same sector, and have a similar market capitalization.
This is easiest done in a code sandbox, but will exist at the following endpoint:
https://financialmodelingprep.com/api/v4/stock_peers?symbol=[Enter Your Ticker]&apikey=[Enter Your API Key]
When searching for stock peers to Apple, FMP responds with a list of similar companies.
	{
		"symbol": "AAPL",
		"peersList": [
			"LPL",
			"SNEJF",
			"PCRFY",
			"SONO",
			"VZIO",
			"MICS",
			"WLDSW",
			"KOSS",
			"GPRO",
			"SONY",
			"UEIC",
			"HEAR",
			"VUZI",
			"WLDS"
		]
	}
Finally, we can also query for Index Constituents. This can be useful to understand the companies that make up a specific index. Similarly, we can query for companies on a specific exchange. Since the returned metadata includes sectors, subsectors, and headquartered information, the savvy coder can parse and filter for specific tickers in a geographical location or market.
Conclusion
By correctly utilizing the FMP API, we can level up our macroeconomic feature incorporation by using features with higher influence and eliminating the need for external data sources. The API documentation explains how to query against the API, allowing us to check if a ticker is valid in addition to what it means. With some data scraping, it’s also possible to compile lists of tickers relevant to specific industries or geographic locations, allowing for templatizing feature library additions. Lastly, we have additional resources on finding relevant indexes or funds and using FMP to find similar drivers.