How to Resolve Common Feature Upload Errors
When uploading features and events, it's essential to navigate potential errors effectively to keep your projects on track. This article covers some of the most common errors you may encounter, along with practical solutions to resolve them.
Understanding Common Errors
1. Duplicate Feature Names / Values
What It Is:
If you see an error indicating that a feature name is duplicated across different dates, it means that the same feature name has been used for multiple entries without differentiation. This happens when a user uses the same generic identifier for multiple different features. This error will occur for both feature name duplicates and feature value duplicates.
How to Resolve:
- Ensure Uniqueness: Each feature name must be unique. For instance, if you have a feature named “Price” for two different product categories, rename one to “Shirt_Price” for one feature set and the other to “Pants_Price.”
- Avoid using generic identifiers such as “FeatureName” or “FeatureValue”.
The local file being uploaded to OneStream must have a Feature Name and Feature Value for every date listed. There cannot be any missing rows or cells, or it will prompt an error.
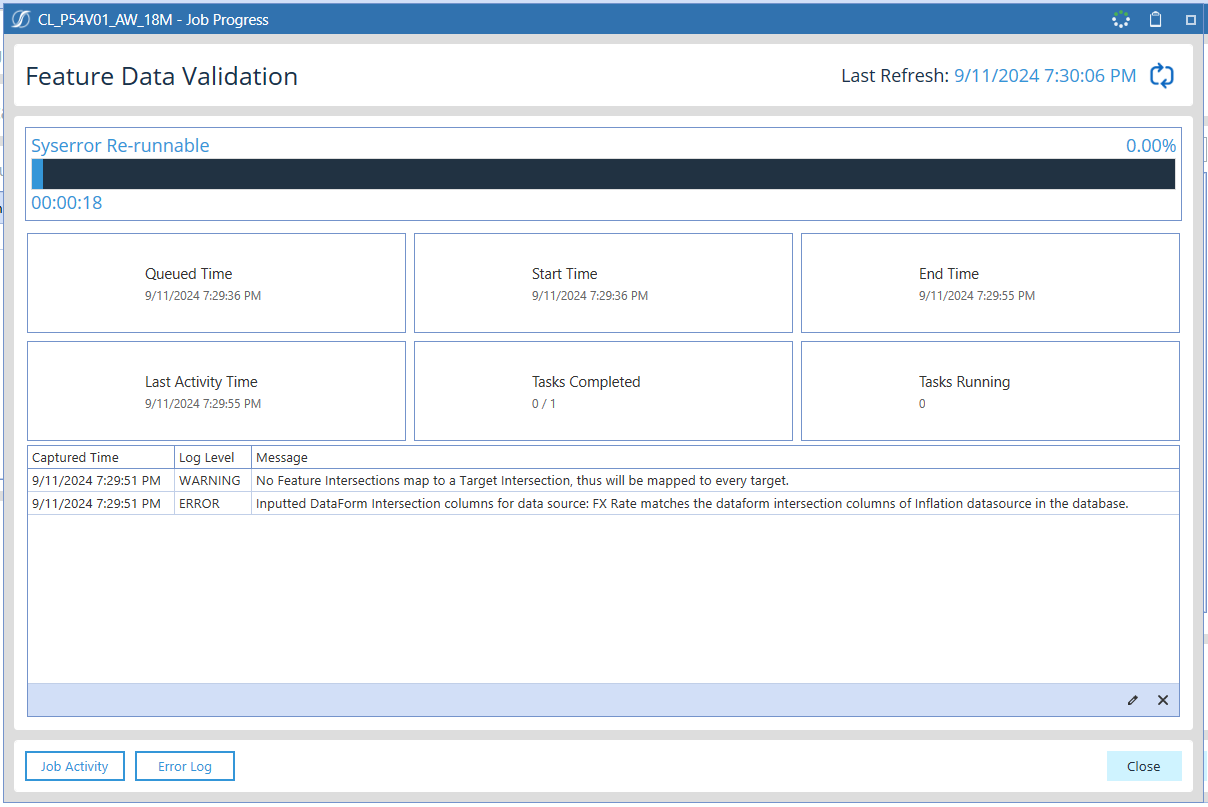
Example Error Message:
Inputted DataForm intersection columns for data source: [Feature Table 1] matches the dataform intersection columns of [Feature Table 2] datasource in the database.
This error indicates that a feature name or value appears in both the FX Rate feature and Inflation feature tables without proper differentiation.
2. Frequency Detection Issues
What It Is:
SensibleAI Forecast (FOR) requires a minimum of three data points to infer the frequency of a feature. If your dataset contains fewer points or if they are too spread out, you will encounter an error message.
How to Resolve:
- Consecutive Data Points: Ensure that your dataset has at least three consecutive data points within a specific time frame. For instance, if you are tracking daily sales, you must have data for at least three consecutive days to allow FOR to detect the frequency.
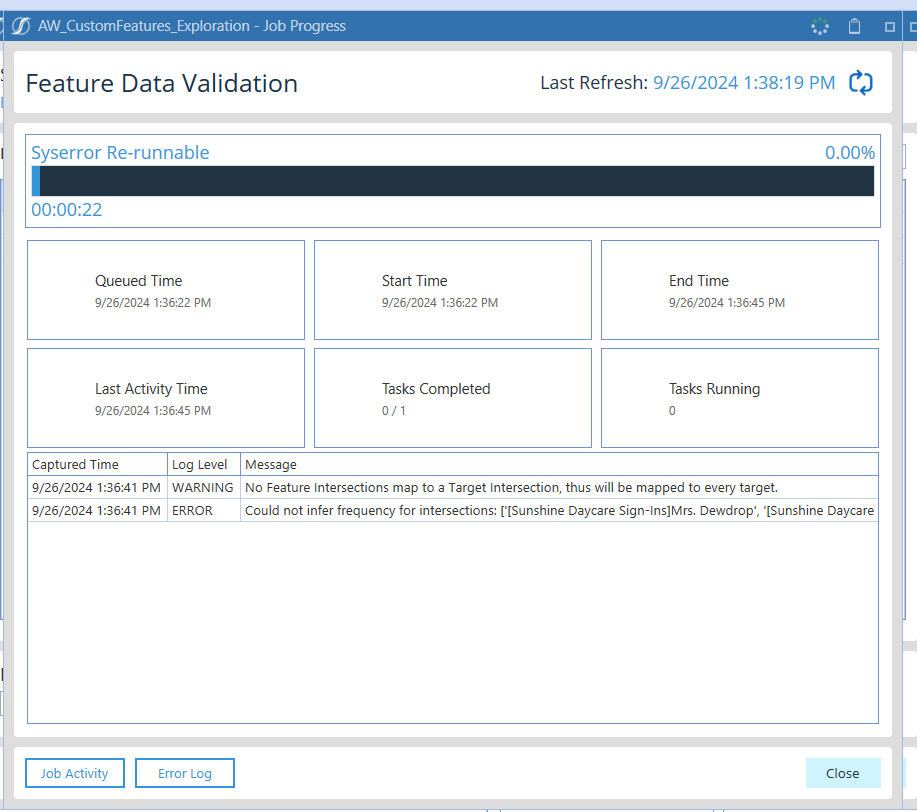
Example Error Message:
Could not infer frequency for intersections: ['[Feature Name]Feature Column Name']
This error means that FOR could not infer frequency for that series. Ensure your data includes enough consecutive points. For the below error example, the target source data is daily.
See the table below to understand how FOR matches actuals and feature frequencies.
Best Practices to Avoid Common Errors
To minimize these common errors, here are some best practices:
- Preprocess Your Data: Before uploading, aggregate or break out features as necessary. For example, if you have hourly data but need daily aggregates, do this before uploading to FOR.
- Consistent Naming Conventions: Stick to a consistent naming convention for your features, which will help avoid duplication and mapping issues.
- Quality Data Collection: Ensure your data collection methods yield consistent and timely data points, particularly for features requiring frequency detection.
Feature Impact Table
SensibleAI Forecast handles features differently depending on their nature. Here’s a quick overview:
Features That Don’t Require Additional Action
- Features with consistent data points, such as daily sales figures, which FOR can process automatically.
- Boolean features indicating yes/no conditions, as they are straightforward and easy for FOR to interpret.
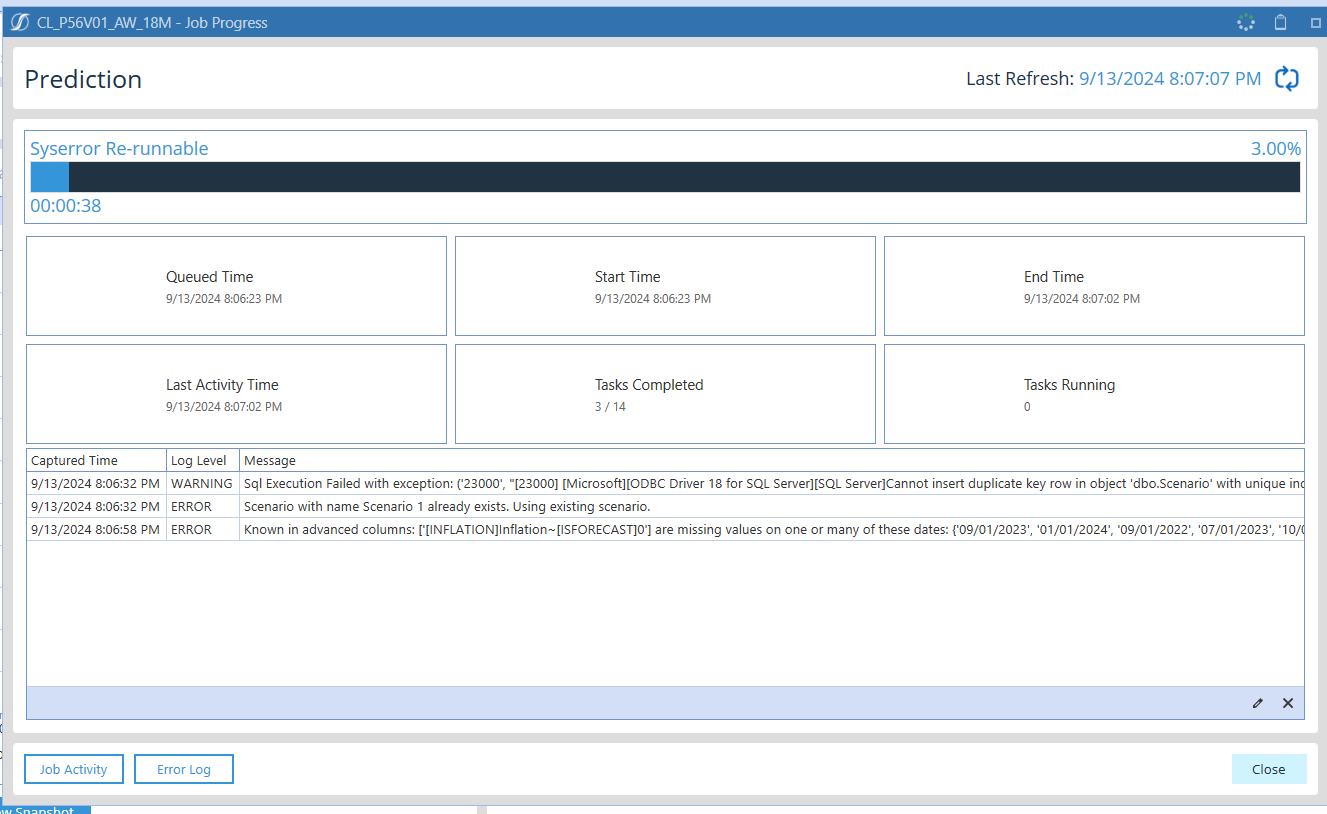
Beware of using a binary system of 0 and 1 to denote Boolean features. Running a project with a feature target dimension that was a Boolean value has allowed projects to run a full pipeline and deploy but cause errors for predictions.
Features That May Need Preprocessing
- Aggregated data: If your dataset includes daily data but you require weekly summaries, aggregate the data before uploading.
- Features with sparse data points: Ensure that there are sufficient data points (preferably consecutive) to allow FOR to detect frequency.
FAQ
Can you apply higher granularity feature data (daily) to lower granularity target data (monthly)? Can you also apply lower granularity feature sets (monthly) to higher granularity target sets (weekly)? How are feature values distributed in such cases?
It is possible to apply numerical feature data across different granularities, both from higher to lower (daily to monthly) and from lower to higher (monthly to weekly). The chart below outlines how features are applied to actuals based on the frequency of the datasets.
Actuals Frequency | Feature Frequency | Matching Algorithm |
|---|---|---|
Daily | Daily | Direct match. |
Weekly | Daily | Average the daily values. |
Monthly | Daily | Average the daily values. |
Daily | Weekly | Use weekly value for every day in that week. |
Weekly | Weekly | Direct match. |
Monthly | Weekly | Average the week values and apply to the month. For weeks that span two months, use a weighted average. |
Daily | Monthly | Use monthly value for every day in that month. |
Weekly | Monthly | Use monthly value for every week in that month. For weeks that span two months, use a weighted average. |
Monthly | Monthly | Direct match. |
Conclusion
Understanding these common errors and their resolutions is crucial for successful interaction with FOR. By following best practices and preprocessing your data correctly, you can minimize errors and streamline your project workflow.