Feature Set Configuration and Interpretability Guide
Overview
SensibleAI Forecast empowers users to enhance forecasting accuracy by incorporating customized features tailored specifically to their use case. Out of the box, SensibleAI Forecast offers the Feature Library to source in 100’s of macroeconomic indicators. However, many organizations that use SensibleAI Forecast also increases in forecast accuracy by sourcing in their own internal drivers such as pricing data, upstream indicators like plant shipment data, etc. Understanding how to effectively leverage custom features can significantly improve predictive performance by ensuring the model is informed by the most relevant and granular information available.
In this guide, you'll learn the critical steps for preparing and uploading custom features, properly configuring them to optimize their use in the forecasting process, and interpreting detailed analytics provided by SensibleAI Forecast. Additionally, you'll discover best practices for managing feature frequency mismatches and appropriately mapping features to specific forecast targets, ensuring accuracy and relevance across different scenarios.
By the end of this article, you'll be equipped to effectively utilize custom feature sets, driving more accurate, actionable, and insightful forecasts with SensibleAI Forecast.
Solution Walkthrough
To effectively utilize custom feature sets, it’s important to understand the key steps involved in uploading and configuring your features.
This section provides context around how to do an “adhoc” upload of feature data via the AI Data Manipulator. If you are looking to put a project into production, you will want to write a reliable data ingress pipeline to automatically source in your custom feature data. This is not explored here.
This article was originally written against the SensibleAI Forecast v3.0.0 build and the AI Data Manipulator Private Preview build (pre v1.0.0). Some of the visuals and screenshots may have changed in future releases of these products.
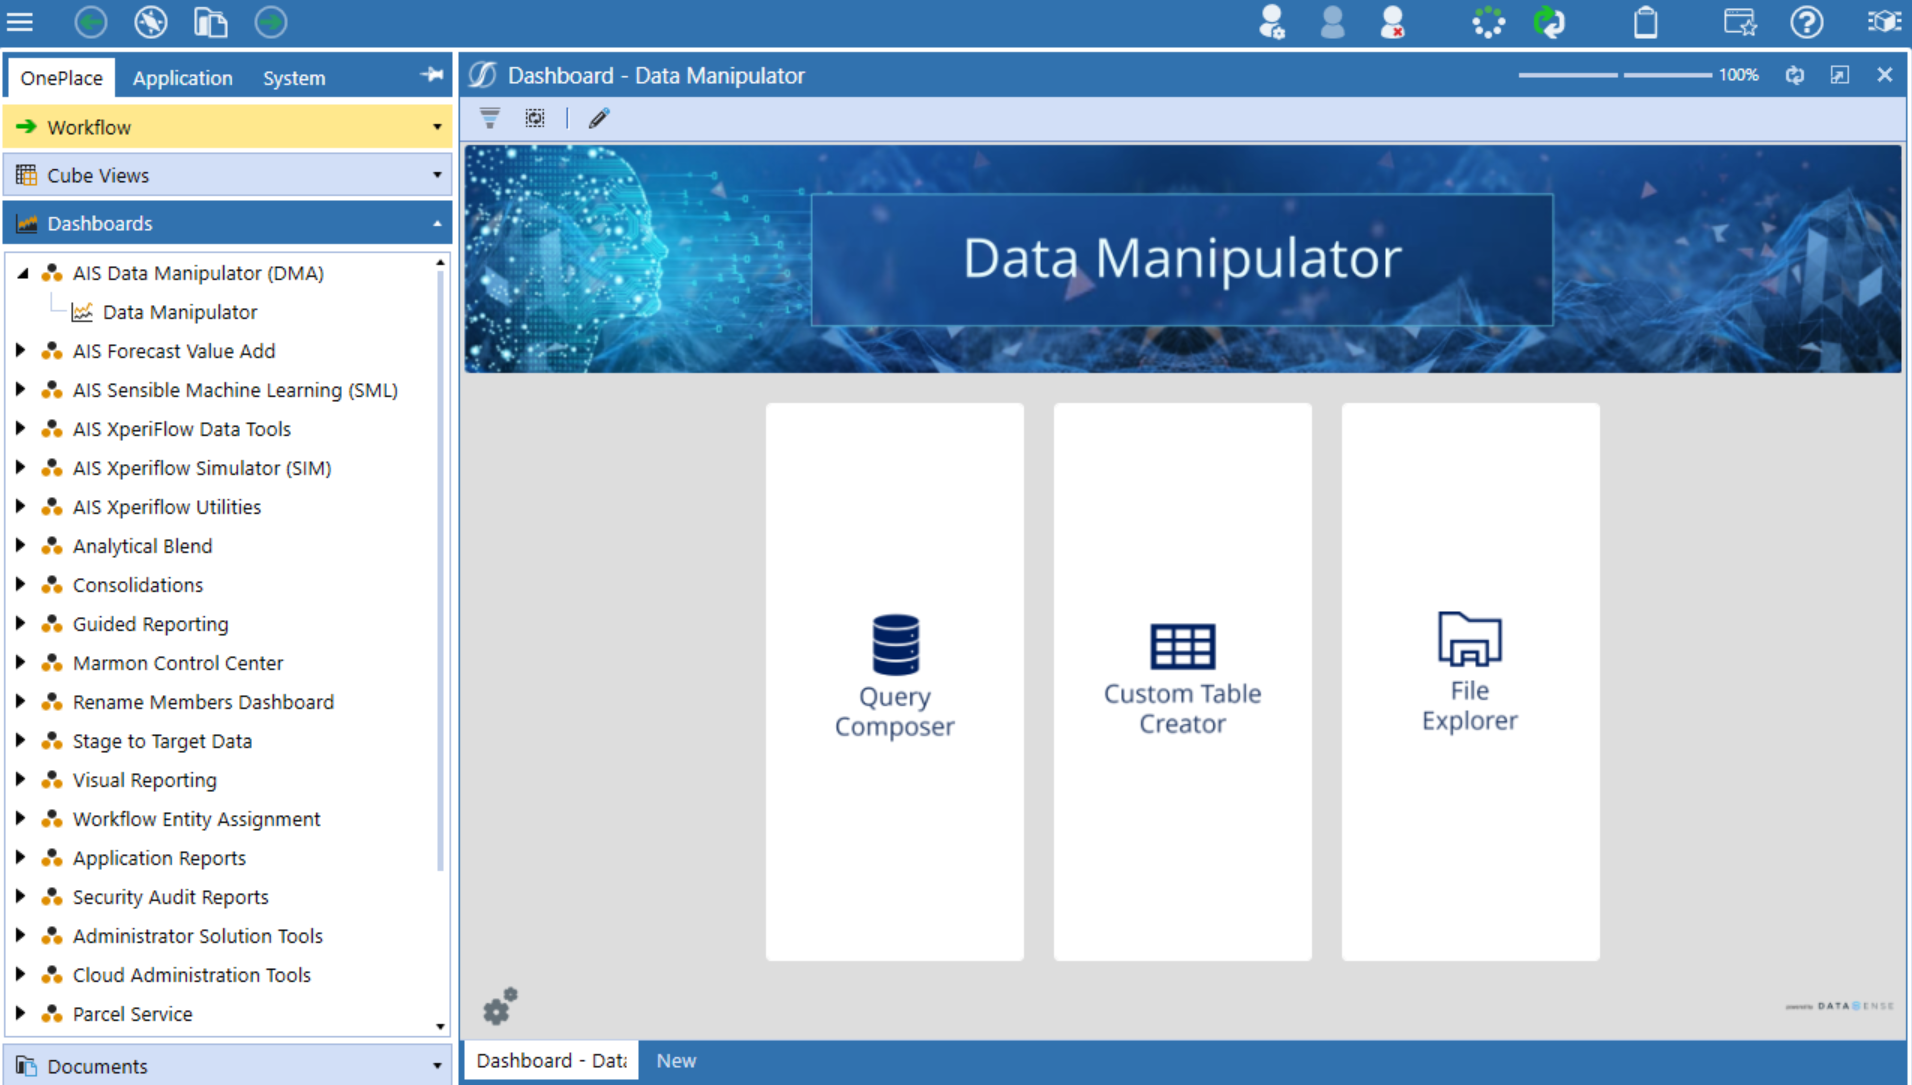
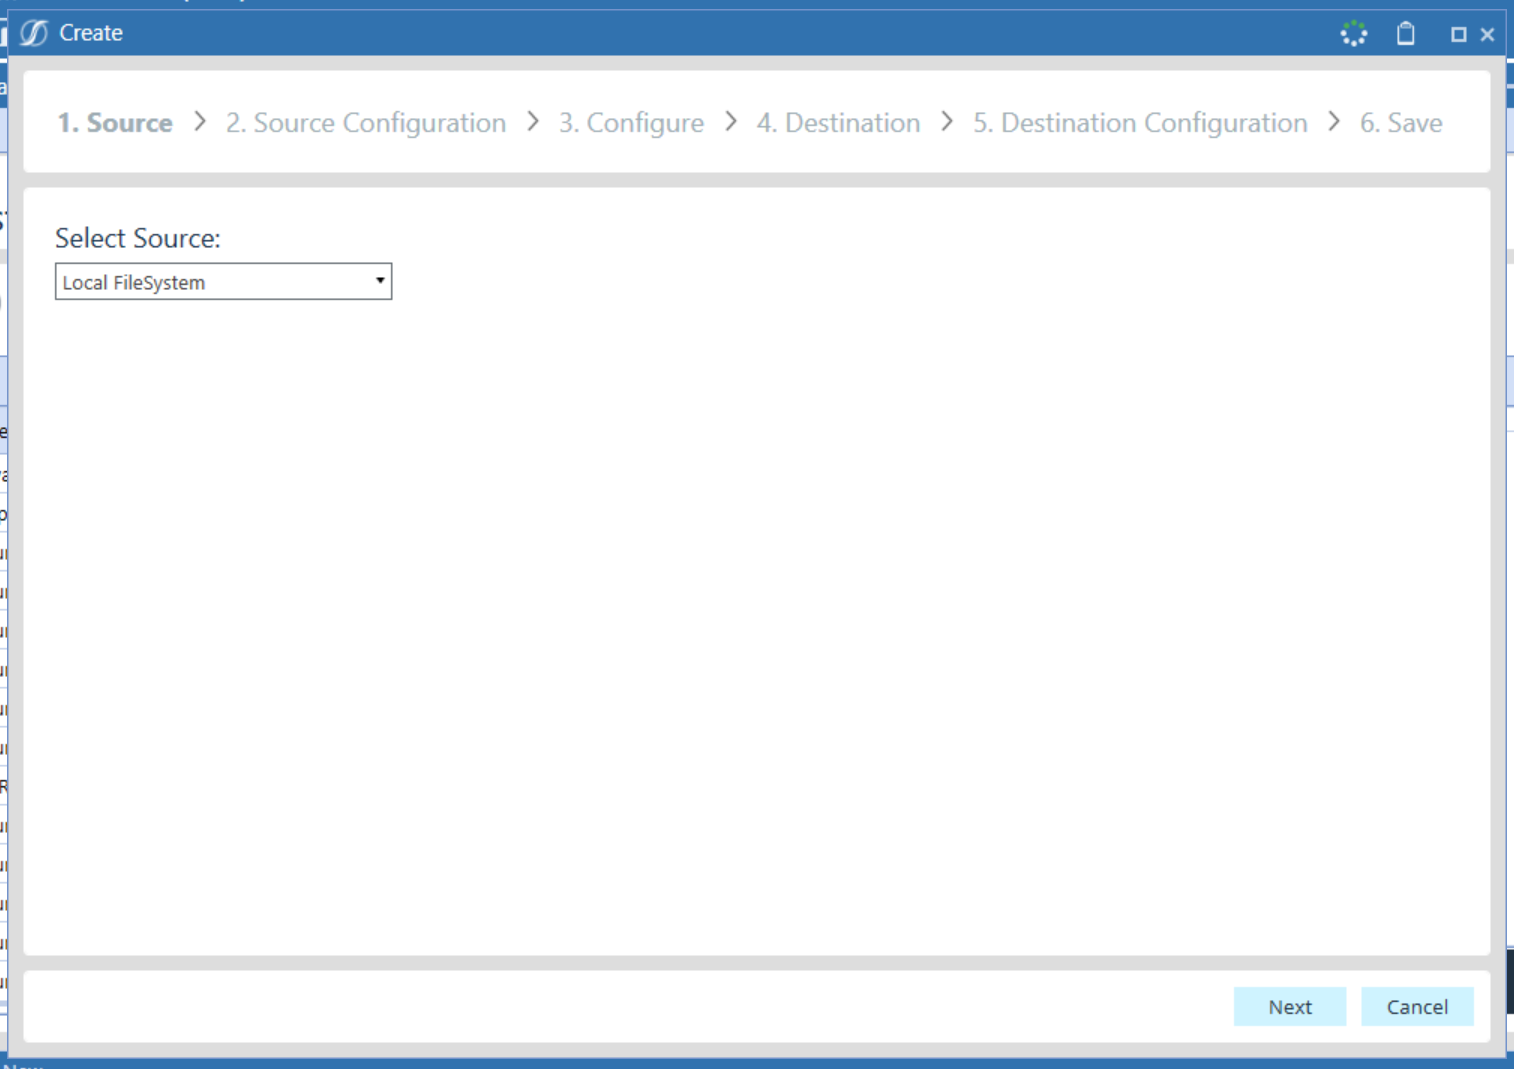
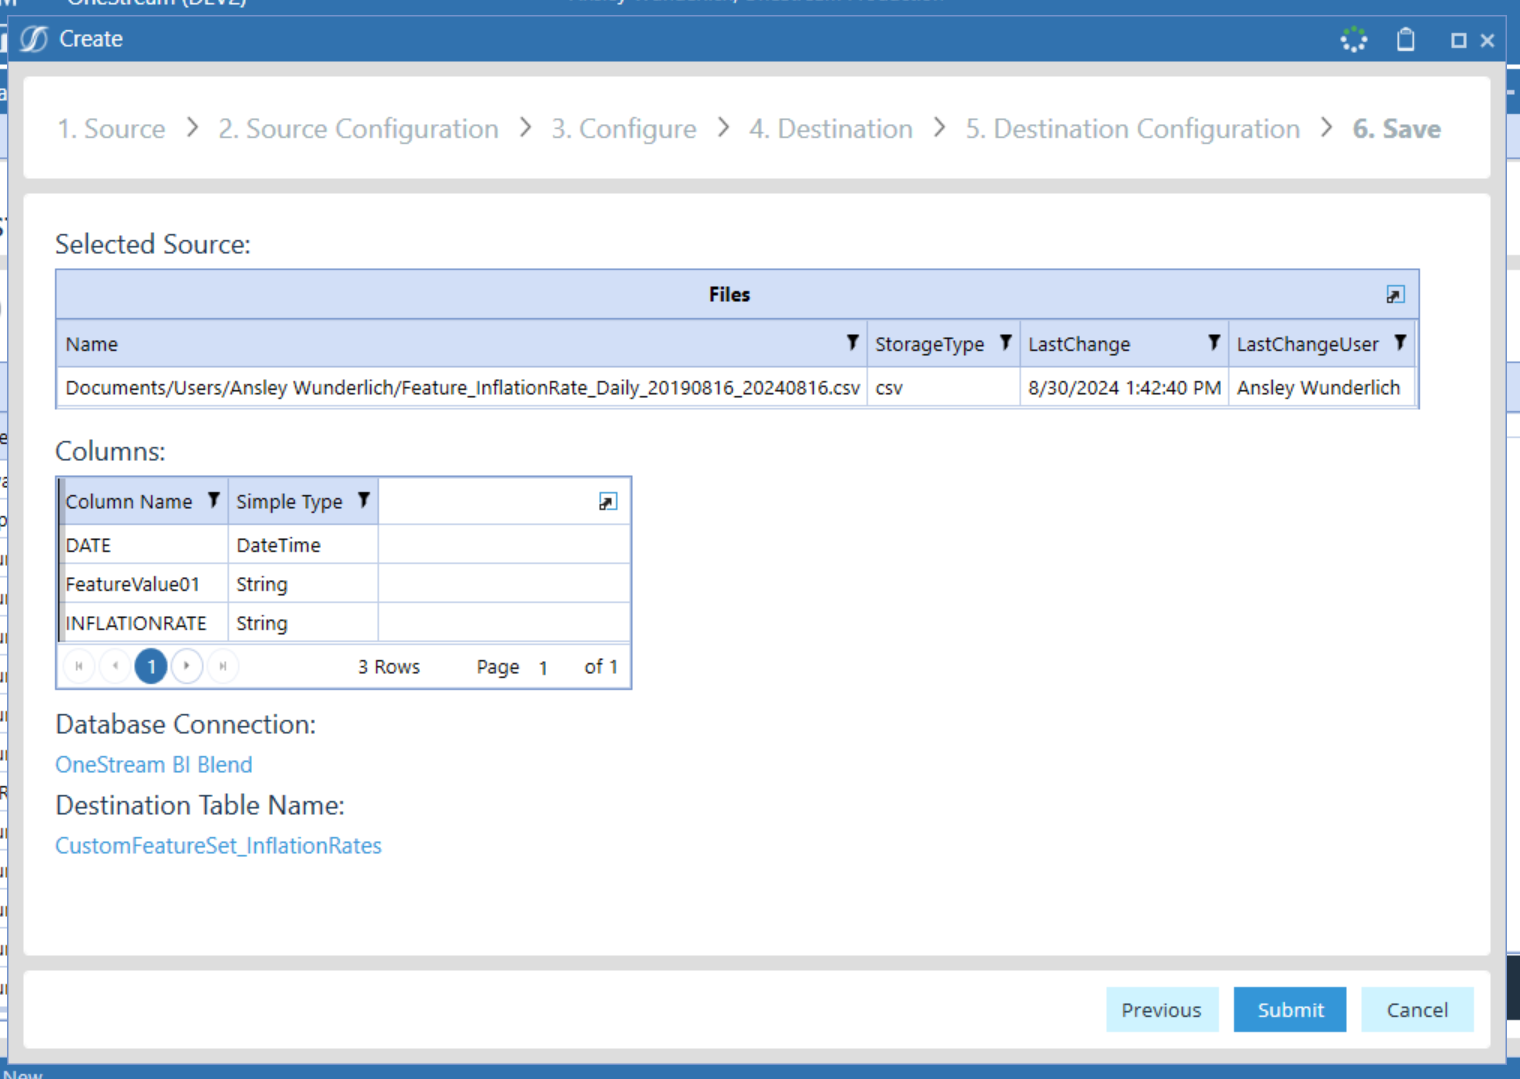
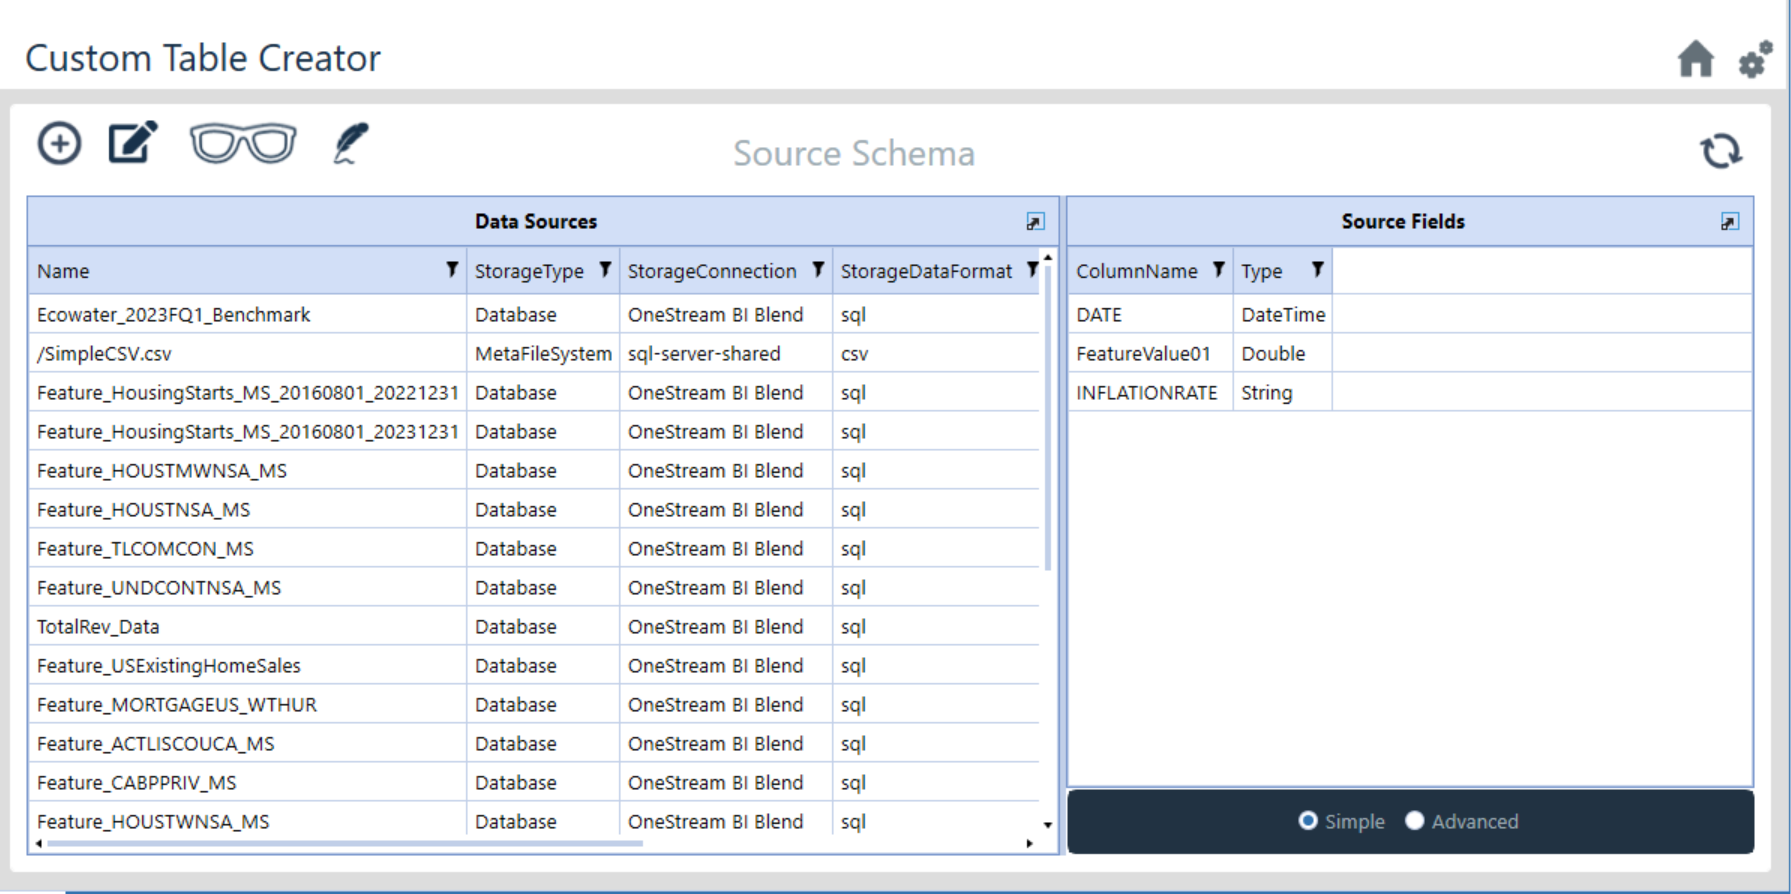
1. Upload Your Feature Set
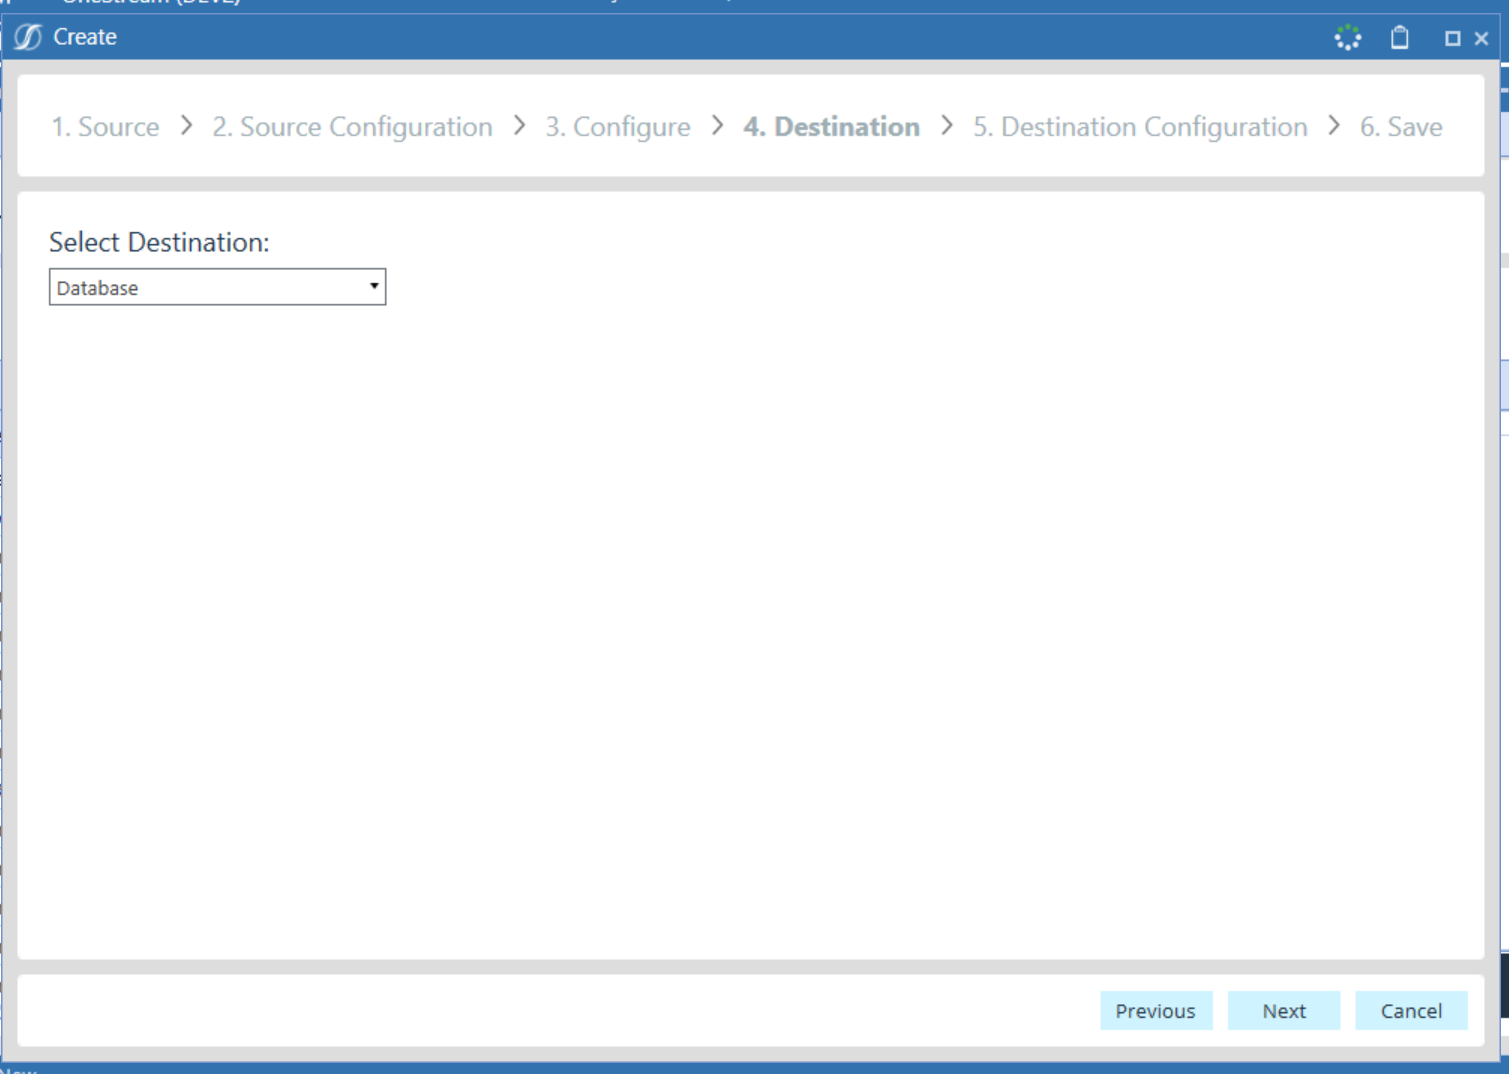
Start by navigating to the AI Data Manipulator tab on the left side of the screen and clicking on the “Custom Table Creator” button.
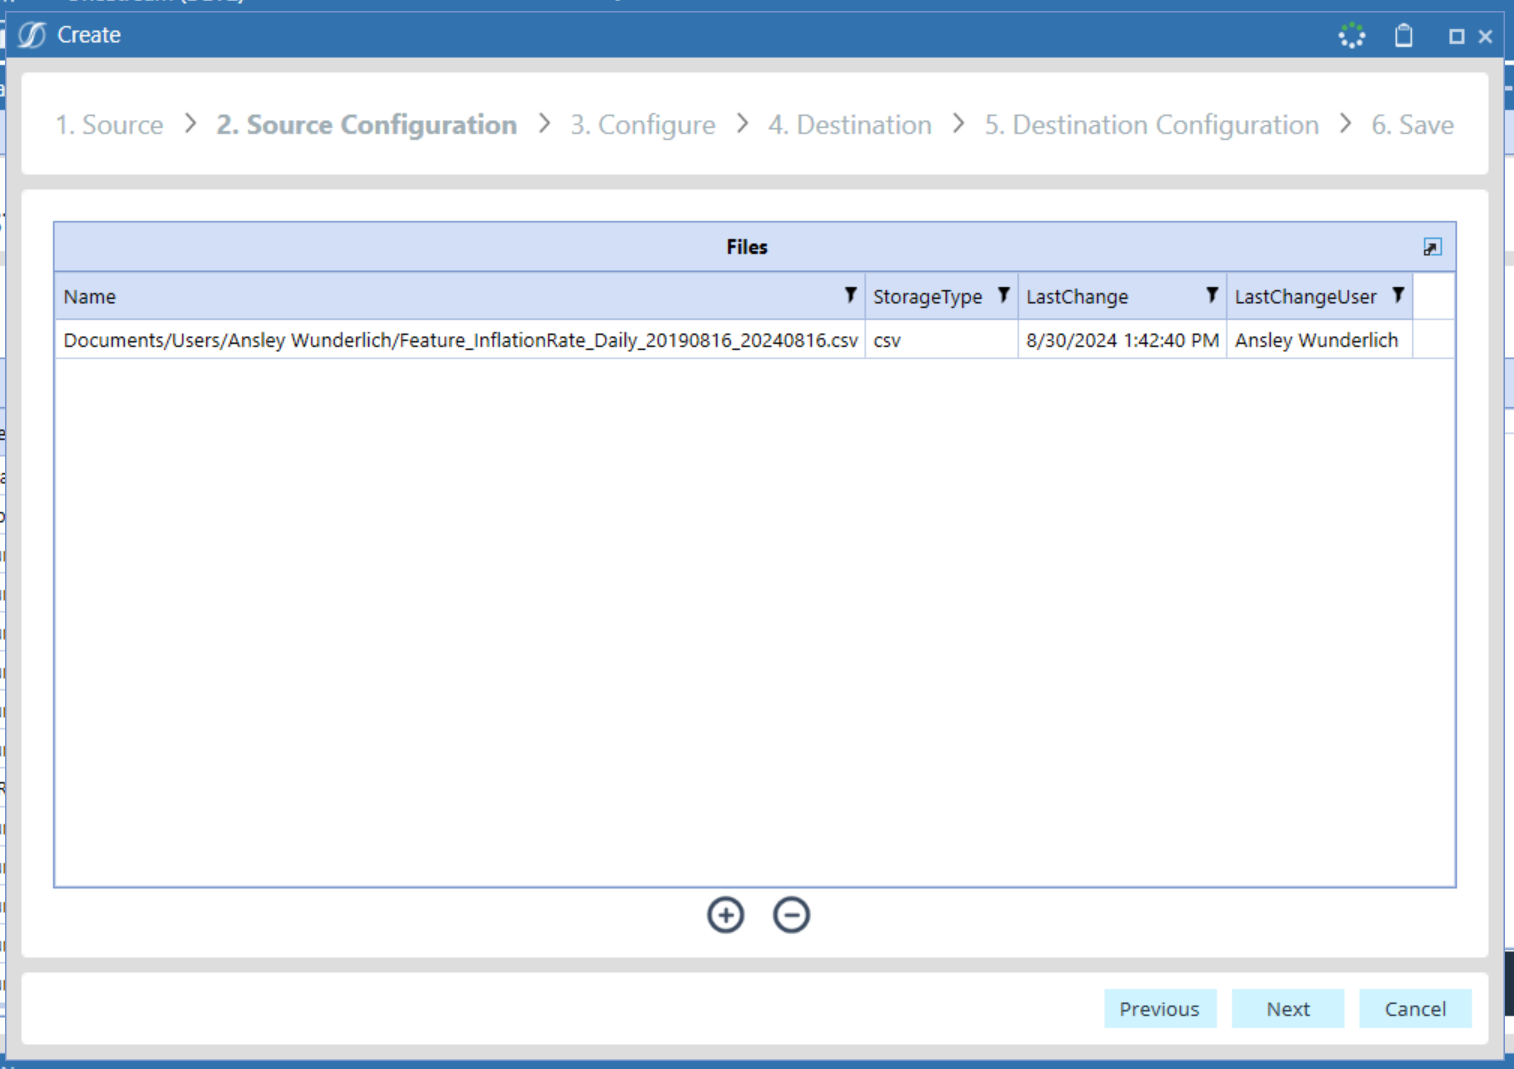
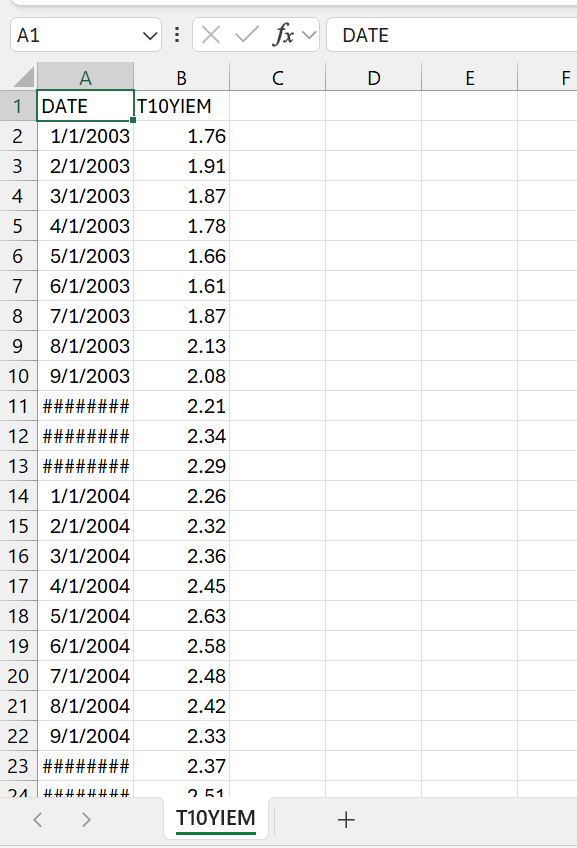
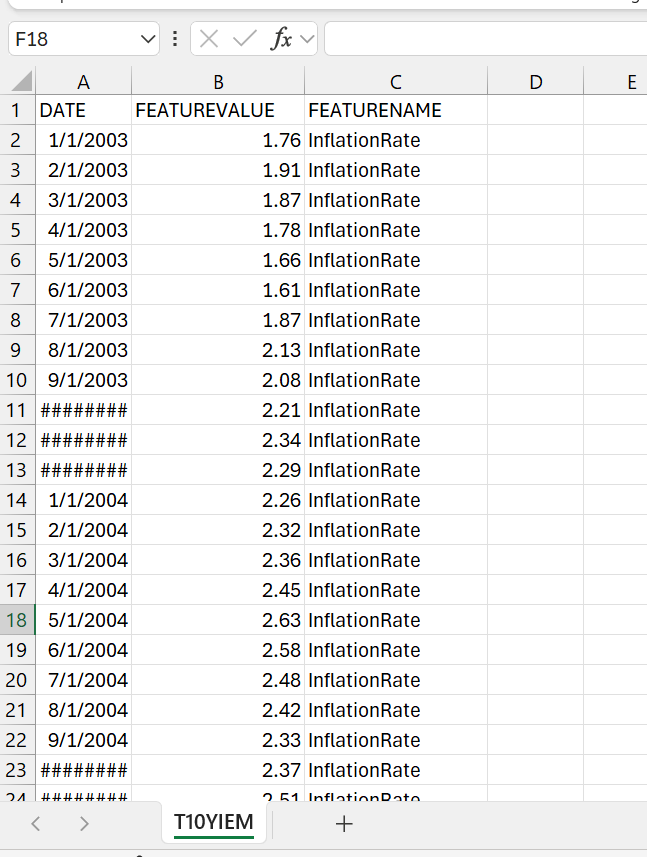
If a file is pulled from a third-party site such as FRED, for example, be sure to manipulate the file in Excel to reflect each of these columns before loading into DMA.
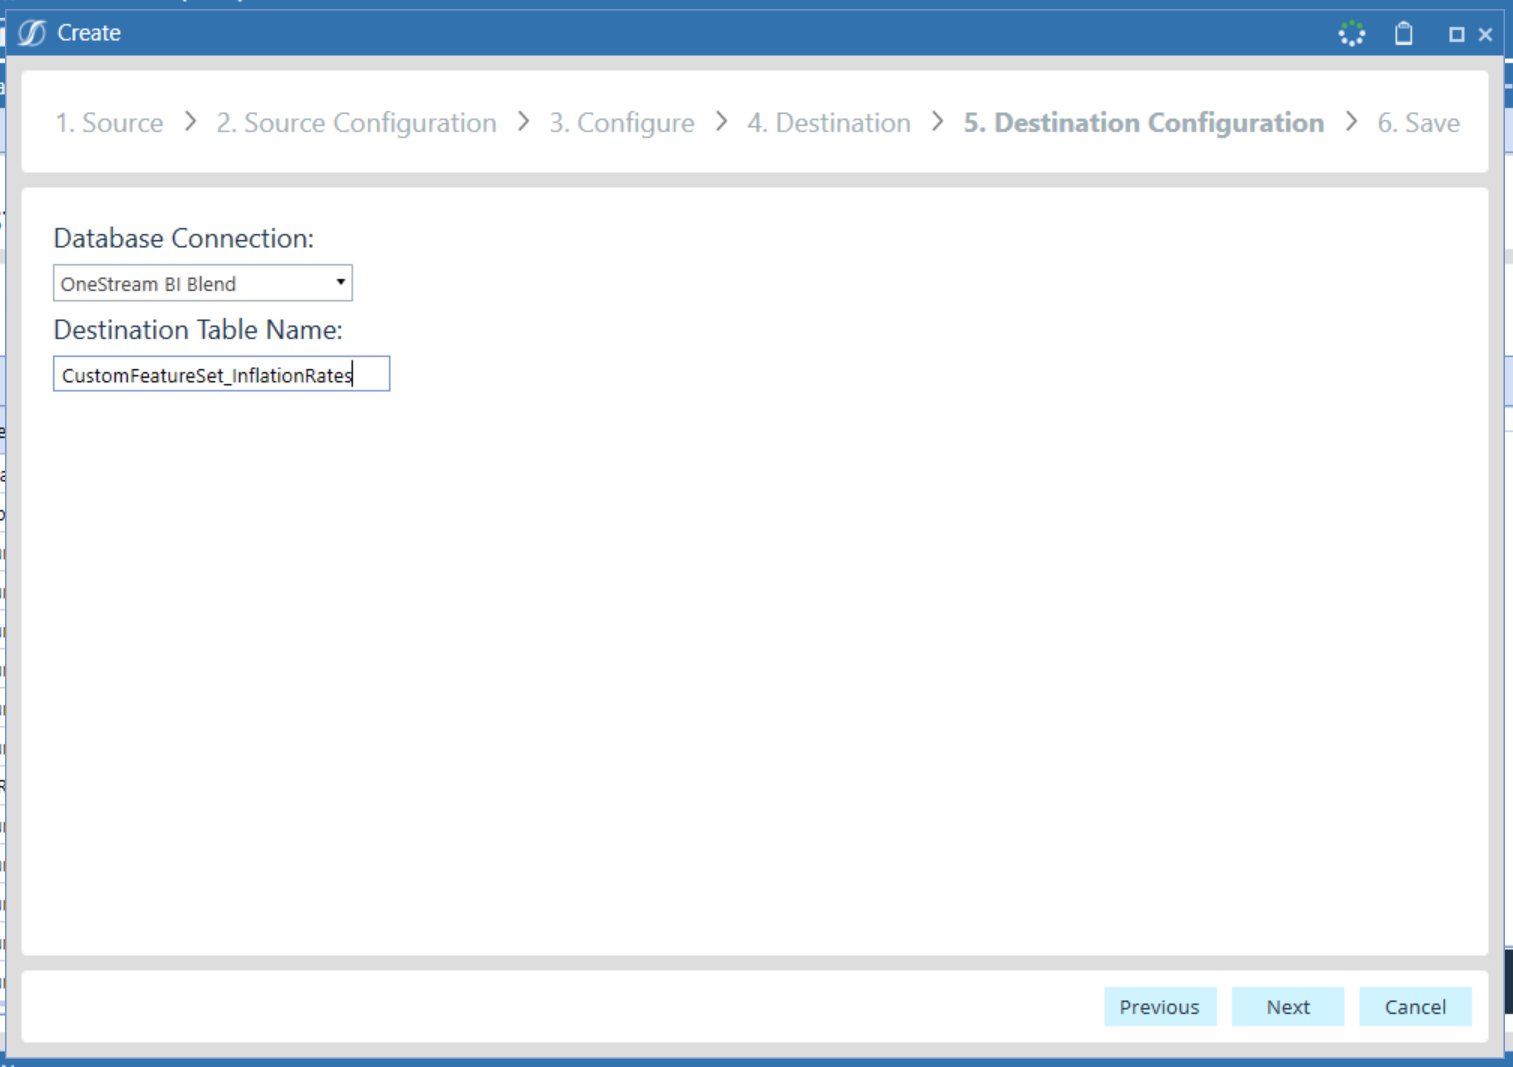
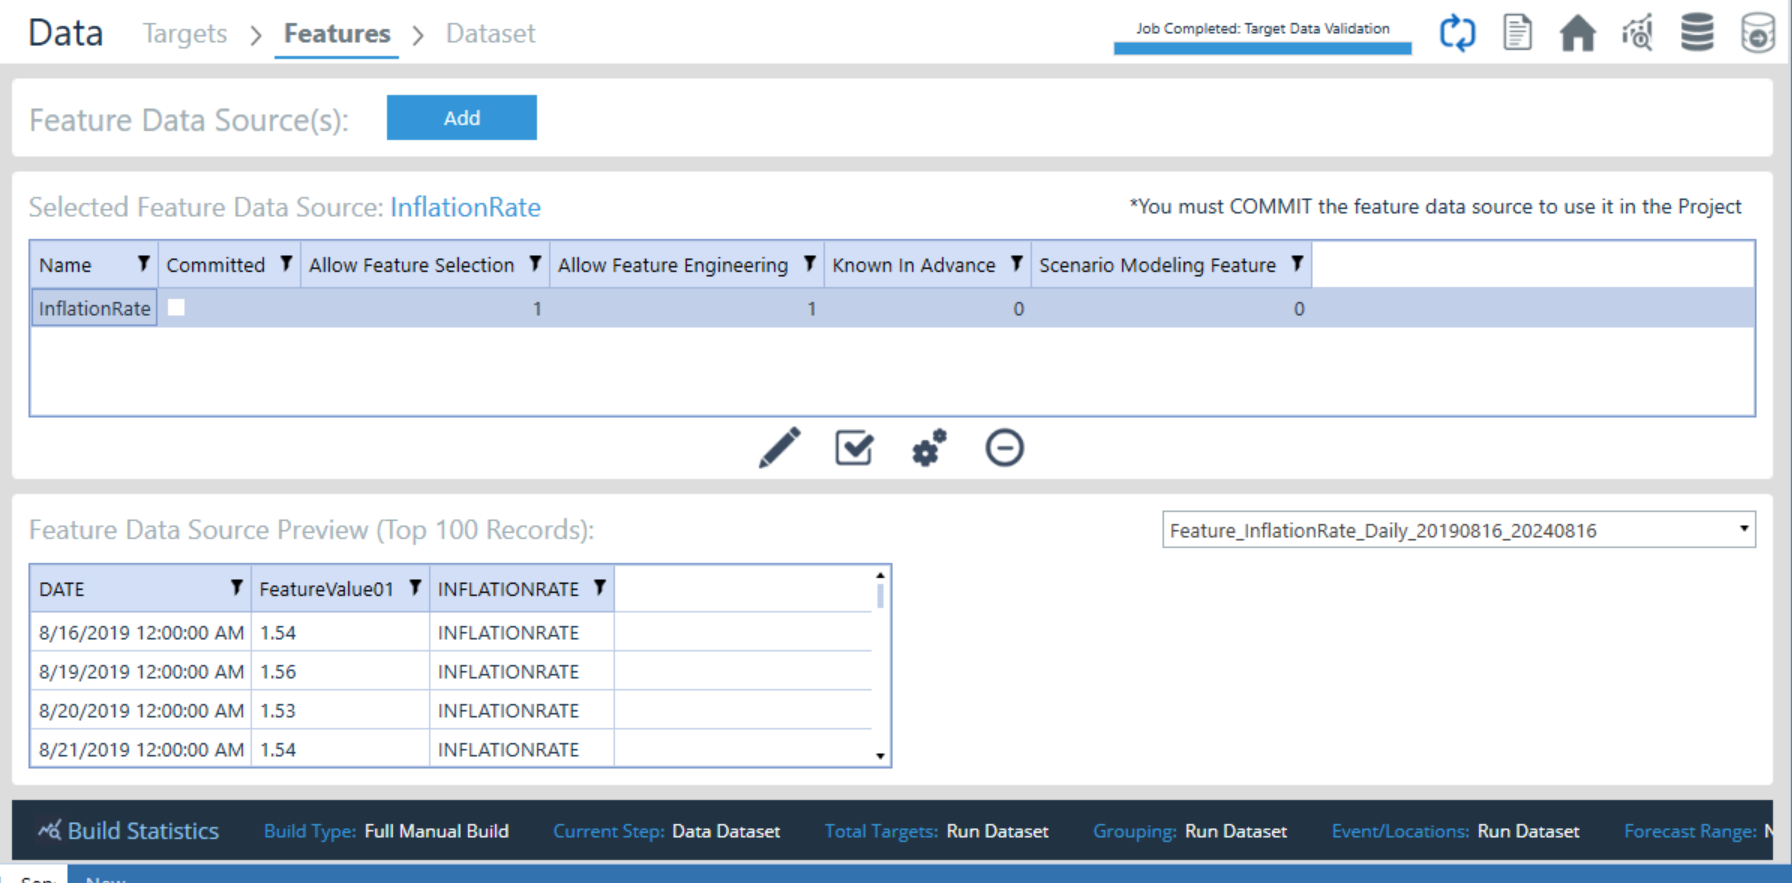
Best Practice: Name all your Feature Sets with the same naming conventions and include the time horizon in case of later resampling. Example: Feature_InflationRates_MS_20190801_20220801
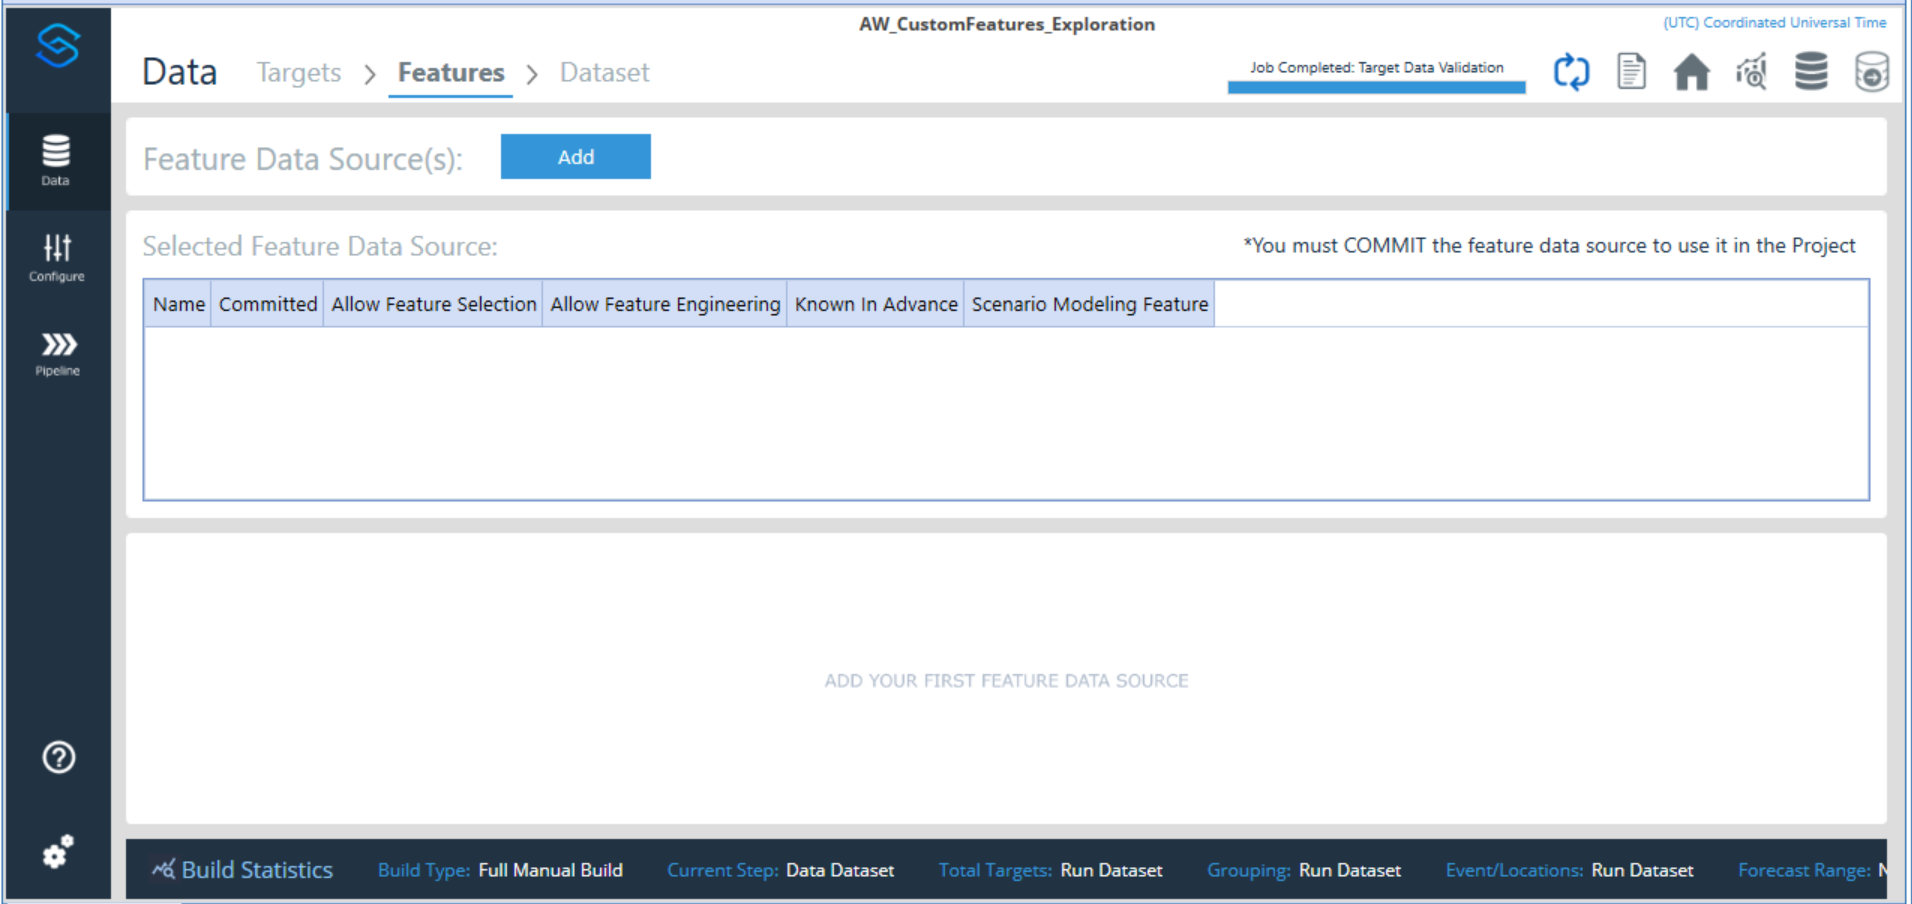
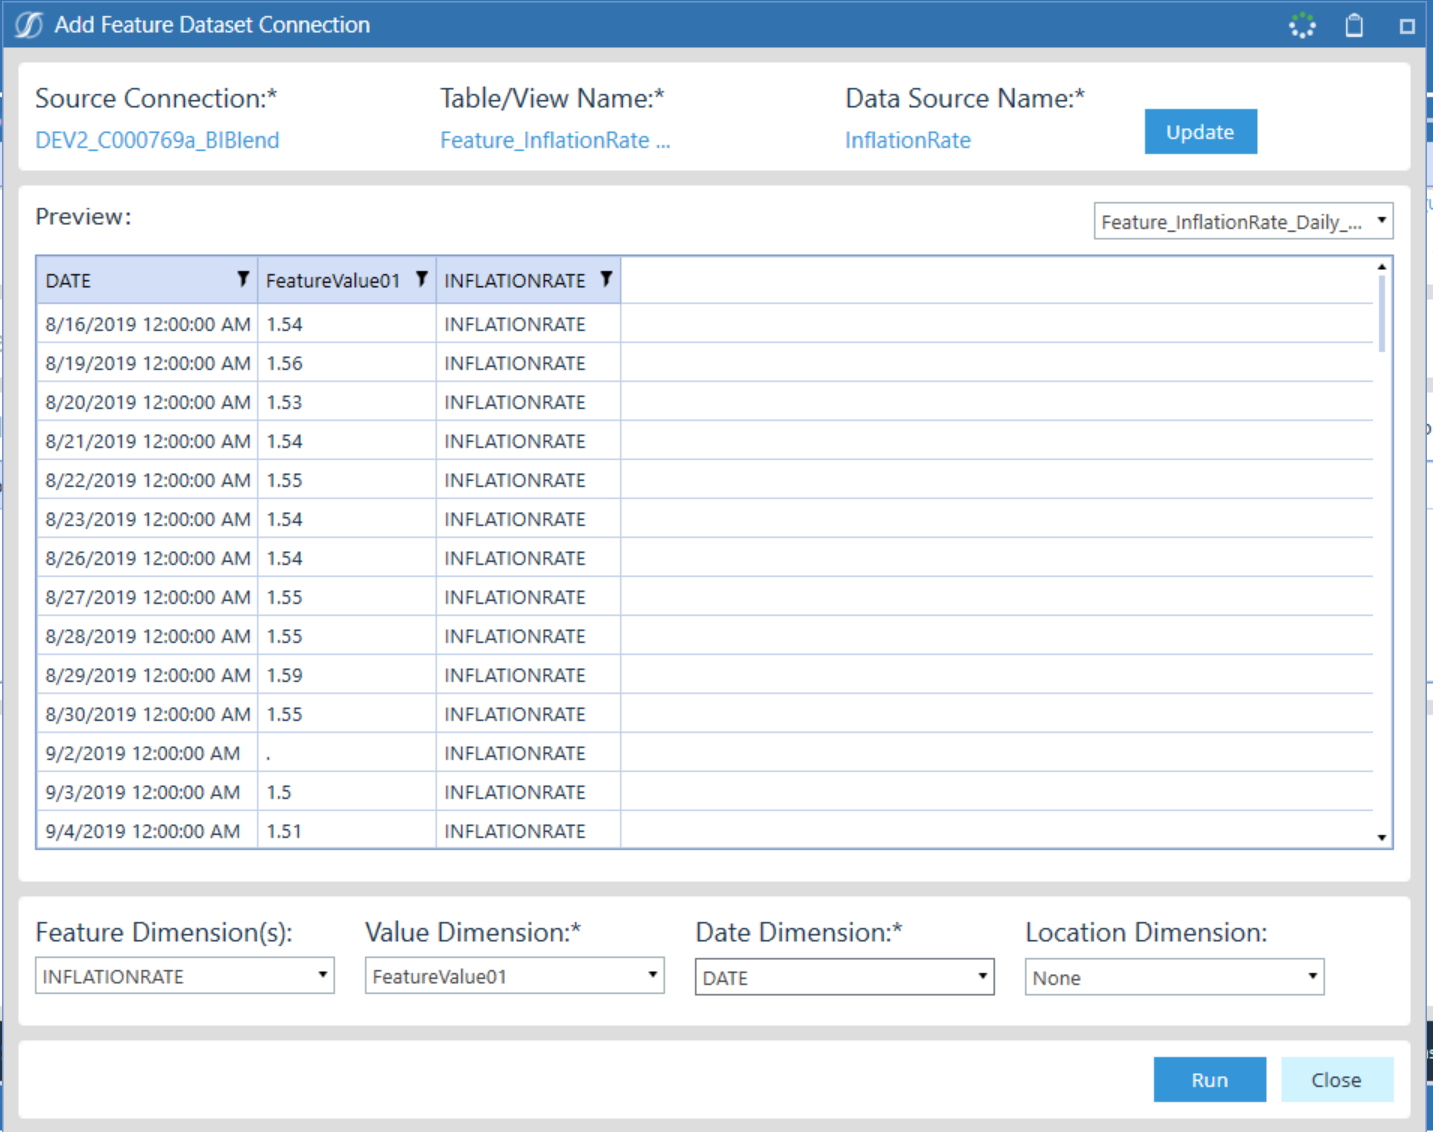

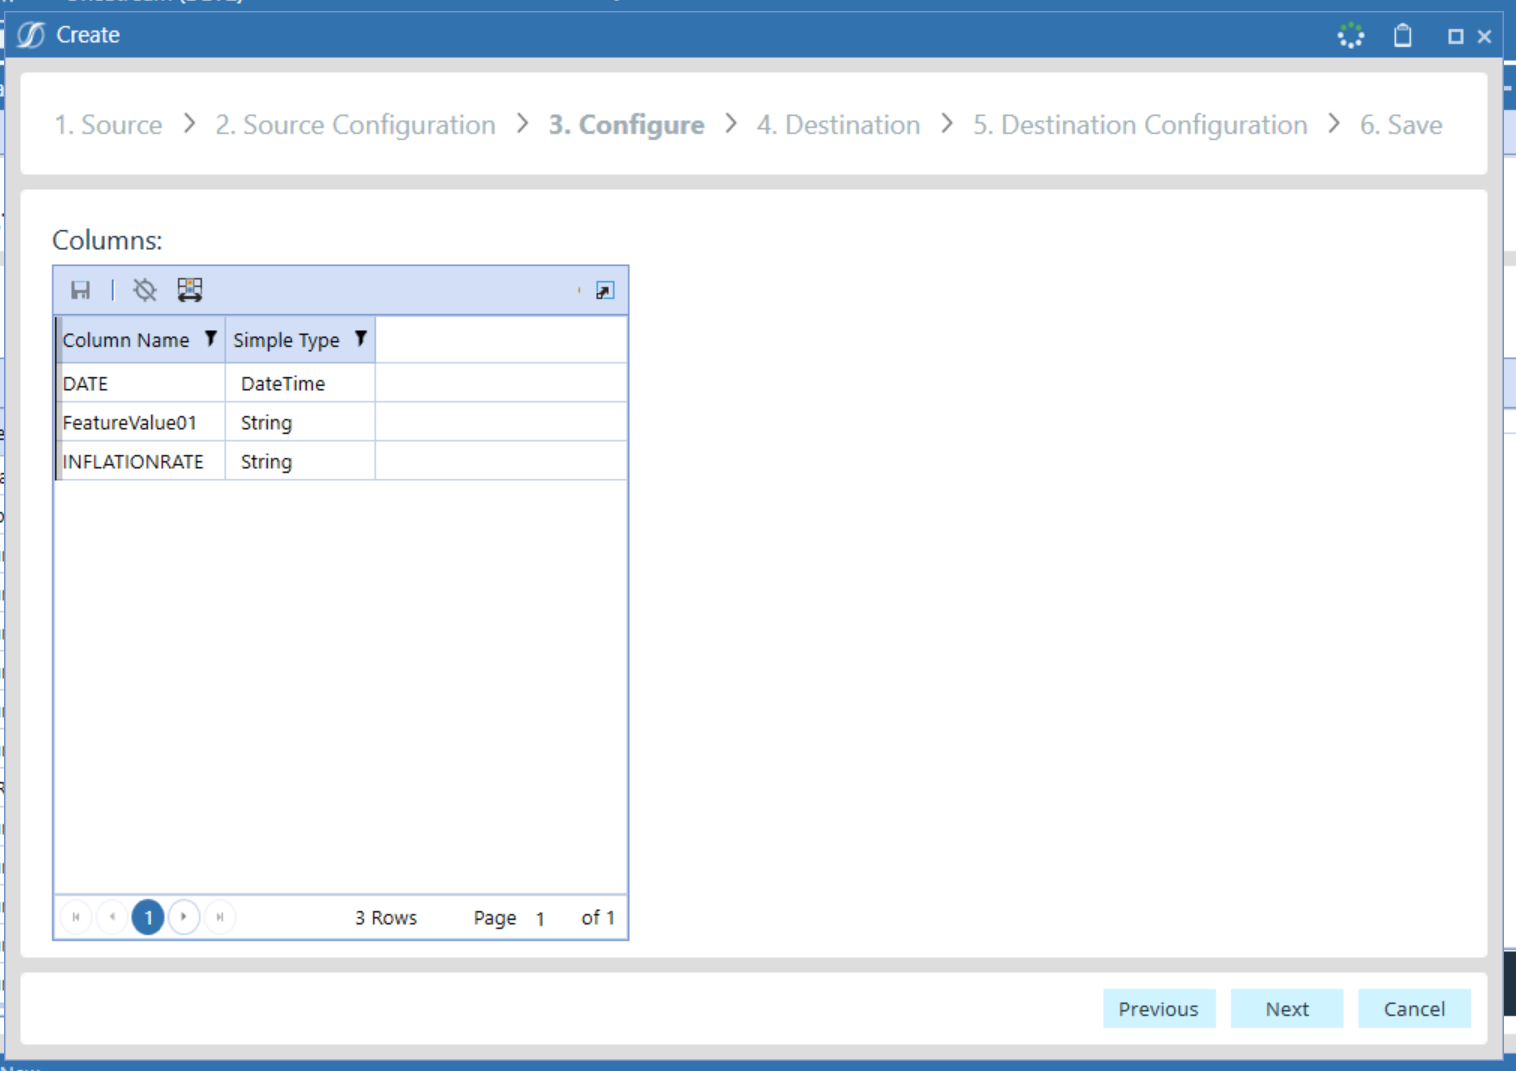
2. Configuring Features
After uploading, you'll need to configure your features.
-
 Update the Selected Feature Data Source: Allows you to change target dimensions, the table alias, or table used for the feature you have selected
 -
 Deleted the Selected Feature Data Source
 -
 Commit or decommit the selected Feature Data Source from the project: If it is committed, it will be utilized by the predictive model, and it WILL NOT be used if it is not committed. You can check if the feature is committed by looking at the “Committed” column and if the Commit icon has a slash through it or not
-
 Edit the Selected Feature Data Source’s Attributes
- There are two views within these settings: “Custom” (Allows you to modify individual targets) and “Modify All” (Allows you to modify all targets)
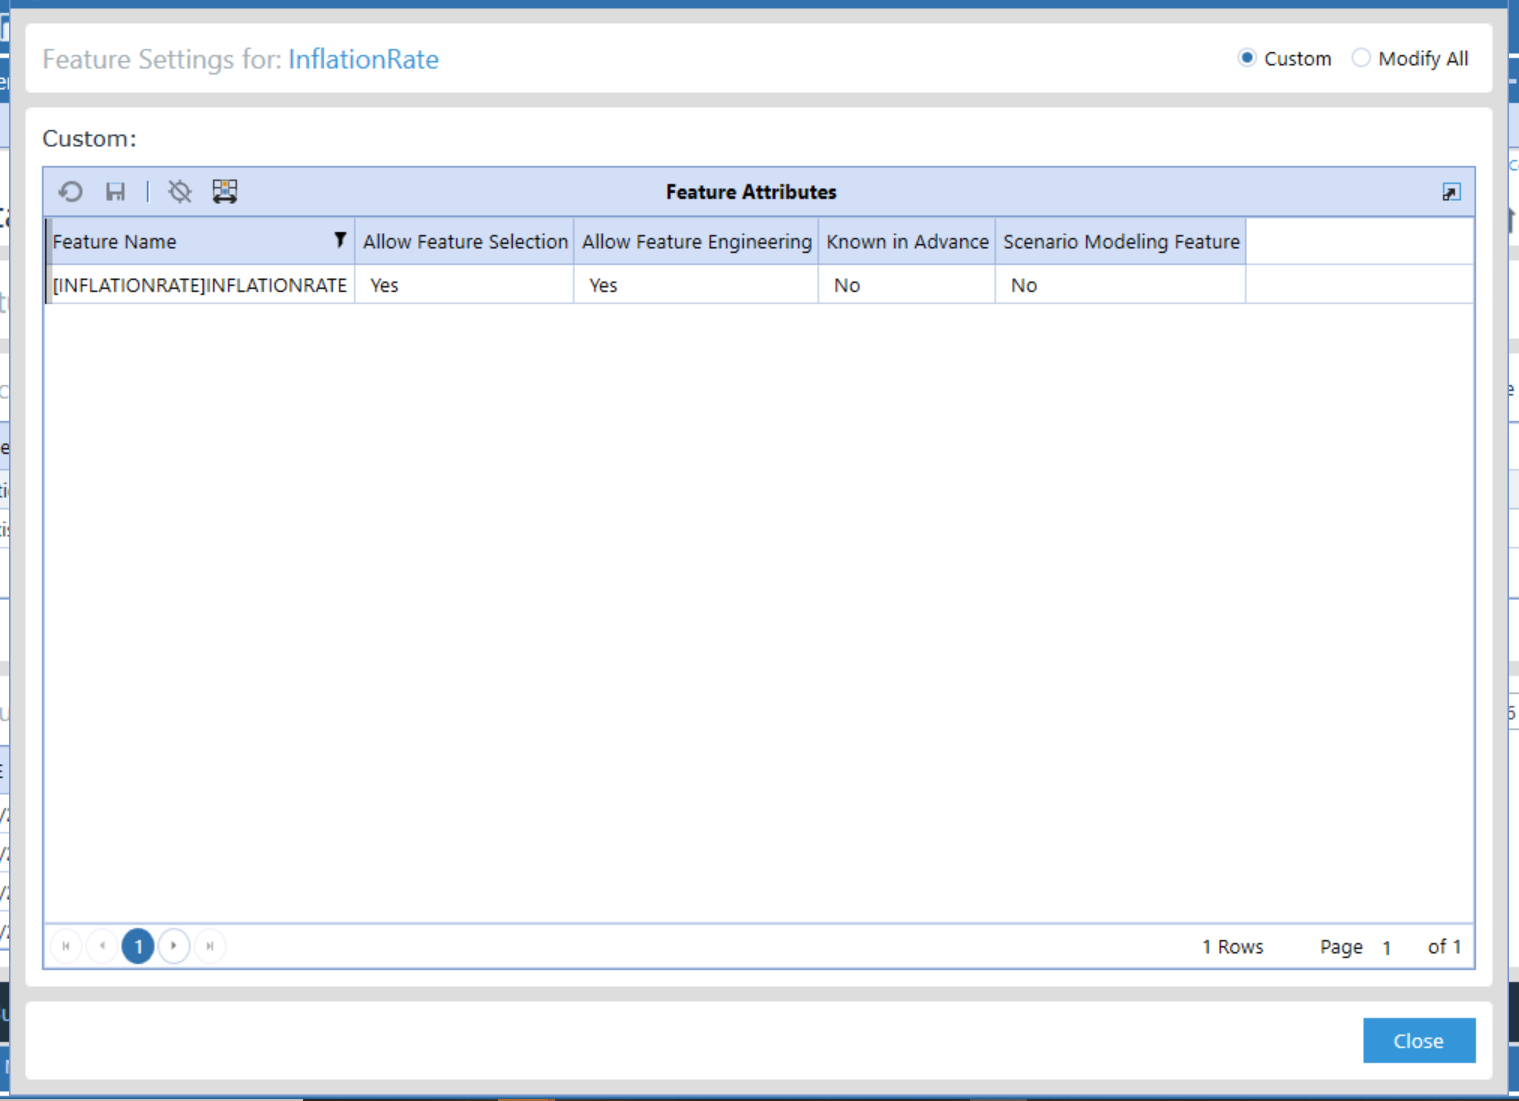
Feature Attributes
- Allow Feature Selection - Determines if SensibleAI Forecast is able to choose whether the feature should be included based on the importance of the feature, based on a series of feature selection algorithms.
- Allow Feature Engineering - Determines if SensibleAI Forecast is permitted to automatically transform your existing features into new forms that may be more predictive for the model. For example, SensibleAI Forecast might create interaction terms between features, generate polynomial features, or apply normalization or scaling to better capture the relationships within the data. In addition, since the dataset includes a date feature, SensibleAI Forecast automatically creates additional features including day of the week, month, and whether it is the start of a month. These derived features can improve the model’s ability to forecast by providing more granular information.
- Known In Advance - A "Known in Advance" feature is data that you have during the forecast period before the forecasted period begins. Examples include scheduled promotions, planned price changes, or seasonal events like holidays. Since these events are predetermined, they can be used to inform the forecasting model about expected variations in the target. When you mark a feature as "Known in Advance," SensibleAI Forecast understands that this feature should be used to inform the model during training for any future periods where actual outcomes are not yet available. For example, if you're forecasting sales for the next month, and you know there will be a promotional discount, that information (the discount) is fed into the model as a predictive input, helping the model to anticipate the impact of the promotion on sales.
- Scenario Modeling Feature - Scenario modeling enables you to modify certain features to simulate different possible future conditions. For instance, you might want to see how a change in price, an increase in marketing spend, or the introduction of a new product line would affect your sales forecasts.
⭐2b50⭐#FFFAE6
Known in Advance Example
Imagine you're forecasting monthly sales for a retail store. You know that in November, there's always a significant sales boost due to Black Friday. You have historical data showing how much sales increase during this period. By marking "Black Friday" as a "Known in Advance" feature, SensibleAI Forecast will use this information to adjust the November sales forecast upward, even though the actual sales data for November isn’t available yet.
3. Review Reports
Once features are configured, you can review the various reports generated by SensibleAI Forecast. These reports will show you how the features impact the model’s predictions, with visualizations to help you interpret the data effectively.
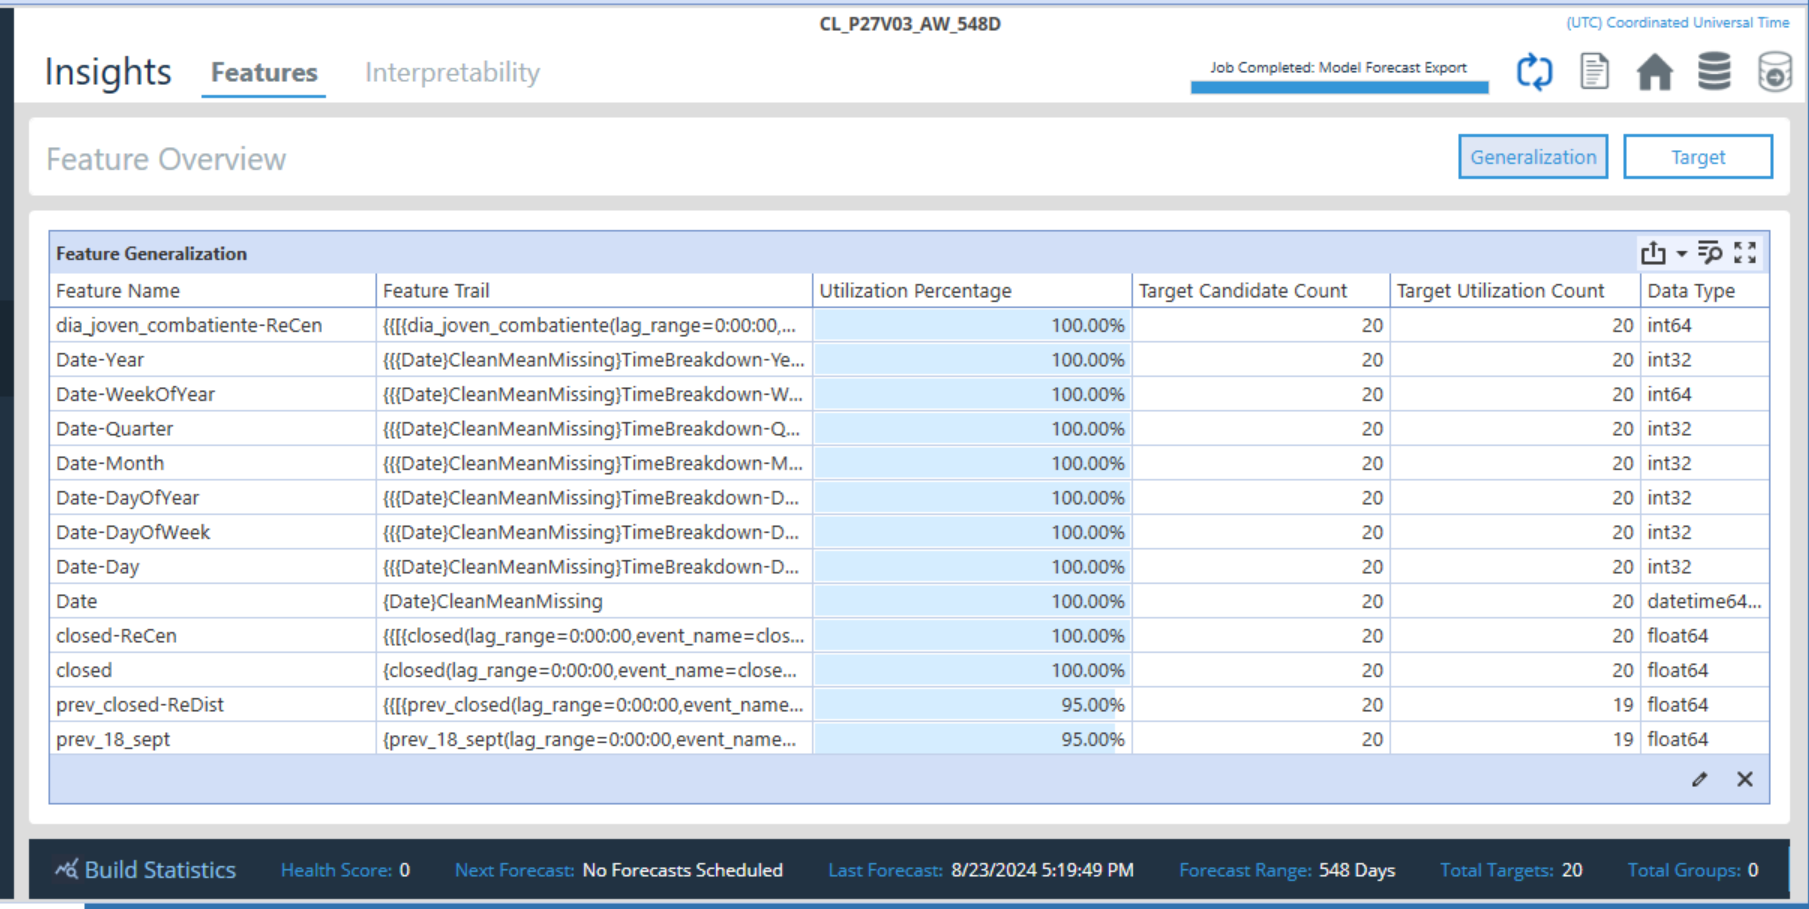
Feature Generalization
- Target Utilization Count - Shows how many of the targets or data points are utilizing the feature information provided
- Utilization Percentage - This percentage is based on the Target Utilization Count and provides the percentage of the target count utilizing the custom feature set uploaded
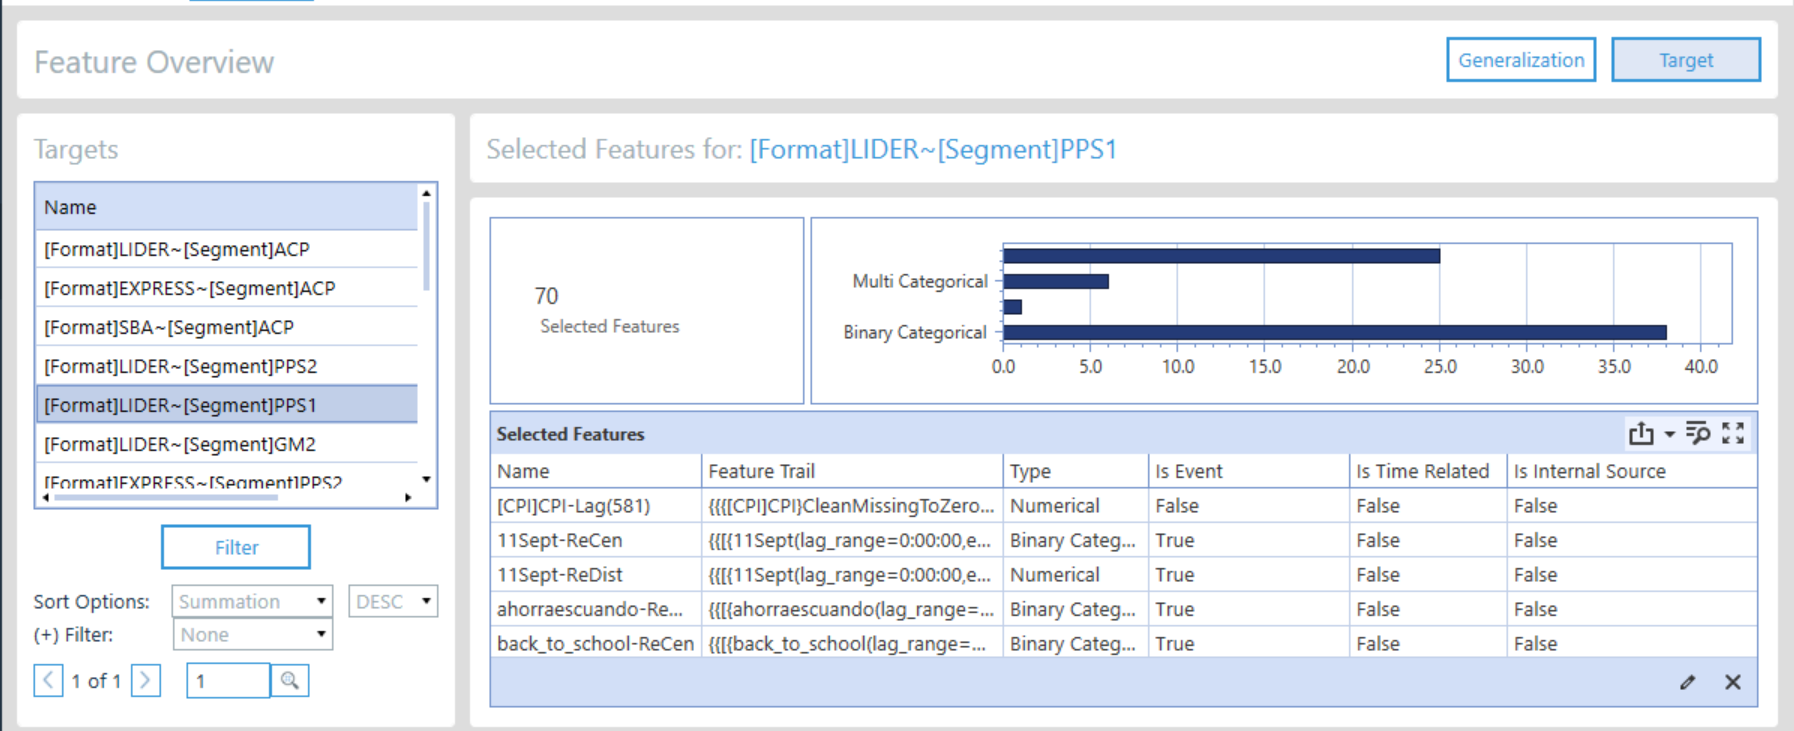
Feature Impact on Individual Targets
This view shows feature impact by model for an individual target. In this view, you can see how many features were selected by the selected model for the selected target. By scrolling in the “Selected Features” section, you can see which features were selected and whether they are classified as events or features in the “Is Event” column.
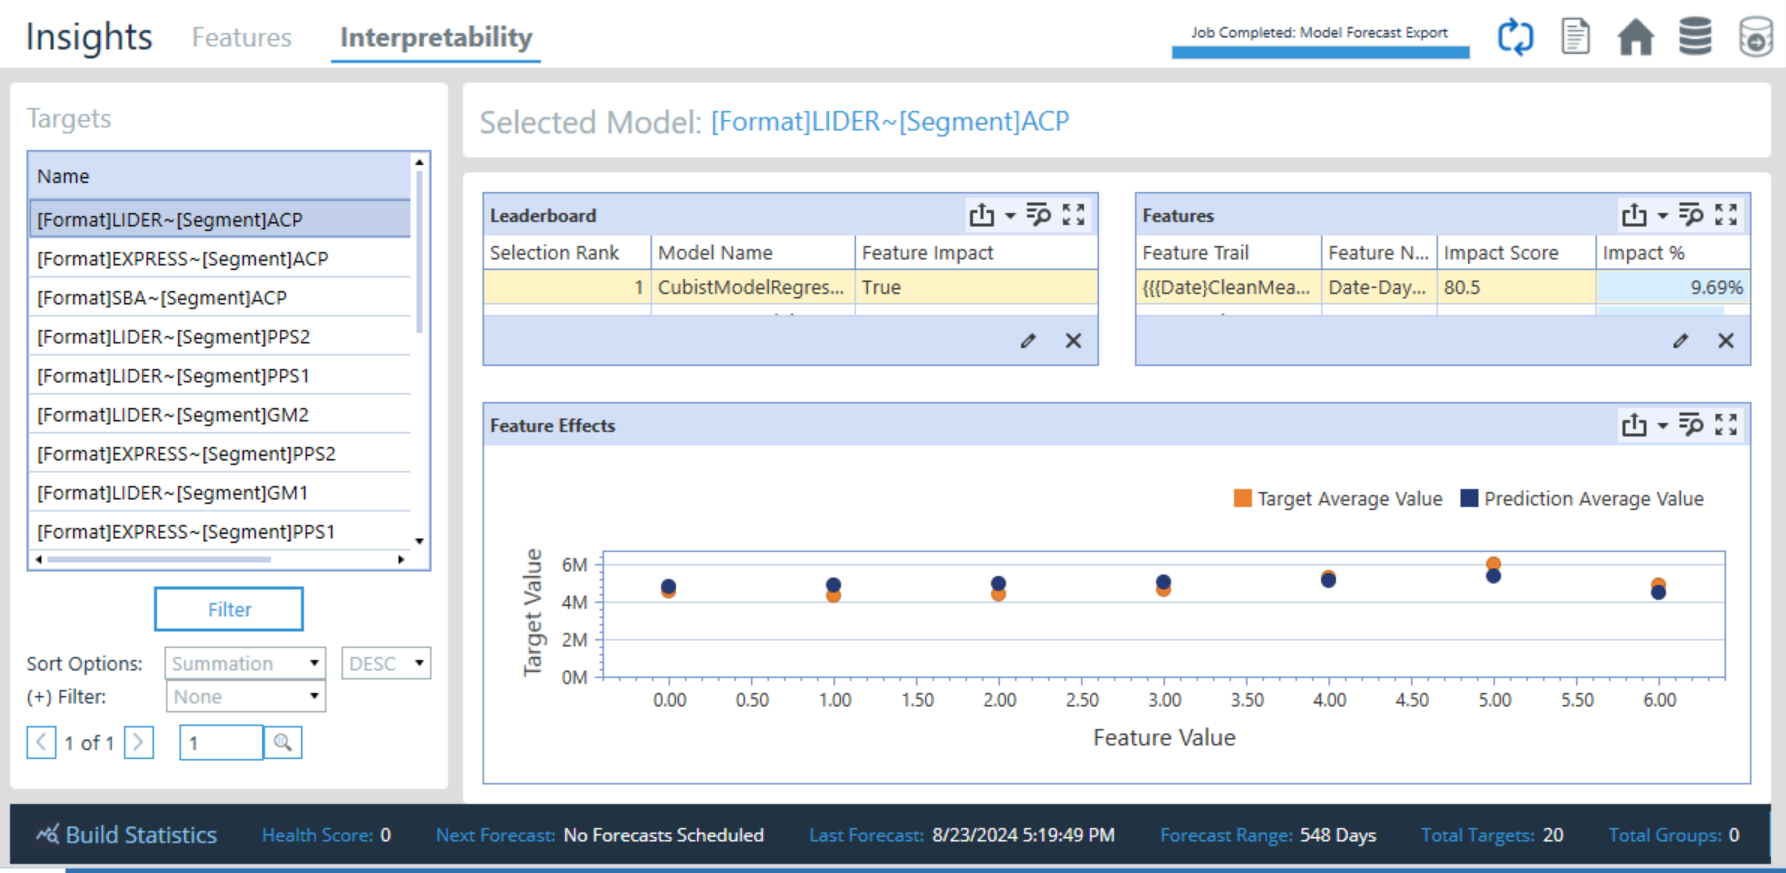
Impact Score and Impact Percentage
The Impact Score quantifies the degree to which a specific feature affects the forecast. A higher impact score indicates that the feature has a stronger influence on the predicted outcome, whereas a lower impact score suggests that the feature has less influence. The Impact Percentage quantifies the relative importance of a feature in contributing to the forecasted outcome. It shows how much of the total effect on the forecast can be attributed to that particular feature.
SensibleAI Forecast's Auto Frequency Detection and Application: Behind the Scenes
SensibleAI Forecast is designed to handle the complexities of integrating features with different frequencies relating to time, ensuring that your data is accurately aligned for forecasting. The process behind this, known as Auto Frequency Detection, is sophisticated, enabling SensibleAI Forecast to seamlessly map features to target data even when there are mismatches in their frequency. Let’s pull back the curtain to explore how SensibleAI Forecast uses features and manages these frequency mismatches, and when you might need to step in for more precise control.
Handling Frequency Mismatches: How SensibleAI Forecast Manages It
SensibleAI Forecast’s Auto Frequency Detection automatically identifies the frequency of your uploaded features and aligns them with the frequency of the target data (actuals). This process is essential when you have features recorded at a different frequency than your target data, such as weekly features that need to be aligned with monthly actuals, or monthly features with daily actuals.
- Straightforward Frequency Mapping: For many cases, SensibleAI Forecast handles mismatches intuitively. For example, if you upload a daily feature like user sign-ups and your target data is daily, SensibleAI Forecast will divide the monthly sign-ups uniformly across all days of that month. This means if your sign-ups are 100 for the month of January, SensibleAI Forecast assumes that each day had 3.23 sign-ups (100/31 days). This straightforward mapping works well when the impact of the feature is expected to be evenly divided throughout the period.
- More Complex Use Cases: However, not all scenarios are as straightforward. For example, if you have a feature representing interest rates, SensibleAI Forecast would divide that rate evenly across all days of the month by default. While this might be appropriate in some cases, it might not always reflect the true nature of the data. It might be more intuitive to preprocess the data yourself by repeating the rate for each day in the month to generate a rate representing all days in the month. This can also be handled by selecting a custom aggregation method in the configuration of the feature datasource attributes (
v3.5.0and up). Either of these approaches ensures that your feature better represents daily activity rather than an evenly distributed monthly total.
Why Proactive Handling Matters
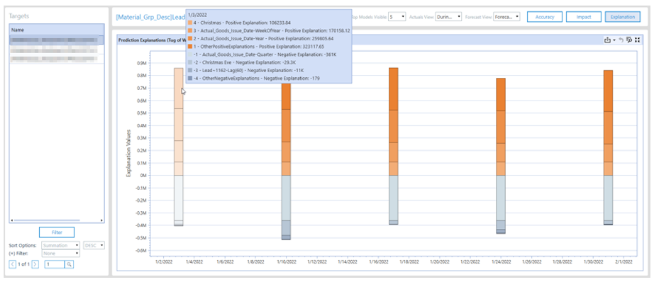
Understanding how SensibleAI Forecast manages these frequency mismatches is crucial because it directly impacts how features are interpreted in your model. For instance, when you review the Feature Impact using tools like the Tug of War chart, the interpretation of a feature’s influence can vary significantly depending on how that feature was mapped in terms of frequency:
- Monthly vs. Daily Interest Rate: If you use a monthly interest rate feature that SensibleAI Forecast divides evenly across each day, the Tug of War chart might show changing impact on different months that have a different number of days. This is because the interest rate at the daily level may have changed across months even though the monthly feature did not. However, if you preprocess the data to convert monthly rate into daily rates, the chart will now reflect the consistent impact of monthly rates, offering more accurate insights into how this feature affects your forecast.
- Impact on Feature Interpretability: The decision to let SensibleAI Forecast handle the frequency mapping automatically or to preprocess the data yourself can significantly affect the interpretability of the results. For instance, using the daily rates might provide a clearer understanding of consistency in sales, whereas using the monthly rates might lead to inconsistent daily fluctuations.
When to Rely on SensibleAI Forecast and When to Preprocess
- Instances Where SensibleAI Forecast Handles It Well: If your feature’s impact is summed across the period, like a monthly interest rate that applies evenly to all days, you can rely on SensibleAI Forecast’s automatic frequency mapping.
- Instances Where Preprocessing Is Necessary: If your feature’s impact varies within the period, such as with fluctuating daily user activity, you should preprocess your data to ensure it accurately reflects these variations. This might involve aggregating daily data into monthly data or breaking down monthly data into daily components.
Balancing Automation with Manual Precision
SensibleAI Forecast’s Auto Frequency Detection is a powerful tool that simplifies the process of integrating features with mismatched frequencies. However, understanding how and when to step in to manually preprocess your data can lead to more accurate and interpretable forecasts. By knowing when to rely on SensibleAI Forecast’s automated processes and when to take control, you can ensure that your features are applied in the most meaningful way, resulting in more precise and actionable insights from your forecasting models.
Feature to Target Mapping in SensibleAI Forecast
Feature to Target Mapping is a crucial aspect of configuring your feature set in SensibleAI Forecast. Properly mapping features to the correct targets ensures that the model can accurately interpret the data and produce reliable forecasts. This process can range from simple, direct mappings to more complex, custom mappings, depending on the structure and requirements of your data.
1. Direct Mapping: Simple and Specific
Direct mapping is the most straightforward way to map features to targets. It involves assigning a feature directly to a specific target by using the target's exact name or identifier.
- Example: Suppose you have a feature representing the price of a particular product. You can map this feature directly to the sales target for that product. This ensures that the price feature only influences the forecast for that specific product.
- Use Case: Direct mapping is ideal when you want a feature to affect only one specific aspect of your model, such as a single product category, a particular store location, or a unique customer segment.
2. Group Mapping: Applying Features to Multiple Targets
Group mapping is used when you want a single feature to influence a group of targets. This method is effective when a feature applies uniformly across multiple categories or dimensions.
- Example: If you have a feature representing a discount applied across all items in a specific category (e.g., all electronics), you can map this discount feature to all the sales targets within that category. This approach ensures consistent application of the discount effect across all related targets.
- Use Case: Group mapping is suitable for features like category-wide pricing, region-specific promotions, or other factors that should uniformly affect multiple targets.
3. Custom Mapping: Handling Complex Relationships
Custom mapping allows for more sophisticated mapping of features to targets. This is often necessary when you need to map features across multiple dimensions or when different targets require different handling of the same feature.
-
Custom Columns: In SensibleAI Forecast, you can use custom columns in your feature set to define how each feature maps to specific targets or target categories. For example, you might map a feature to multiple targets using specific dimensions, such as mapping a promotional feature to all products sold in a particular region during a specific time period.
-
Constraints and Considerations:
- Feature Values: One key limitation is that SensibleAI Forecast does not allow the same feature to have different values mapped to different targets within the same date range. For instance, if you have a price feature, you cannot map different prices to different products using the same feature. Instead, you would need to create separate features, such as "hotdog price" and "hamburger price," to avoid errors.
- Mixed Mappings: If you need to mix and match mappings within the same feature set—such as mapping one feature to a specific target and another to a group of targets—you may need to carefully structure your feature set. In some cases, it might be necessary to break out features into separate columns or datasets to accommodate these different mappings.
4. Managing Mismatched Mappings
When dealing with mismatched mappings—where different features need to map to different targets in varying ways—it's important to understand the limitations and possibilities within SensibleAI Forecast:
- Multiple Dimensions: If you have a feature set where one feature maps to a specific target (e.g., a product category) and another feature maps to a broader group of targets, you must ensure that your feature set structure supports these mappings. This might involve adding extra columns to define how each feature should map or splitting the feature set into different datasets to handle the complexity.
Avoiding Errors: To avoid common errors, like mapping the same feature to multiple targets with different values, ensure that each feature-target relationship is clearly defined and does not conflict with other mappings. This might require creating additional, more granular features or restructuring your data to fit within SensibleAI Forecast's constraints.
5. Practical Examples and Tips
- Example 1: Suppose you're forecasting sales across different food items, and you have a feature set that includes pricing data. If you have a general "price" feature, you'll run into issues if you try to map it to different products with different prices on the same date. Instead, you would create specific features like "hotdog price" and "hamburger price" to ensure that each feature maps correctly to its target.
- Example 2: If you're working with a feature like "seasonal discount," and this discount applies across multiple categories, group mapping allows you to apply the discount feature to all relevant targets simultaneously, simplifying the setup and ensuring consistency across the board.
Mastering Feature to Target Mapping
Understanding how to effectively map features to targets in SensibleAI Forecast is critical for accurate forecasting. Whether you're using direct, group, or custom mapping, each method serves a specific purpose and comes with its own set of considerations. By carefully structuring your feature sets and understanding the limitations of each mapping type, you can ensure that your model accurately captures the relationships between features and targets, leading to more reliable and insightful forecasts.