Ensuring Quality Time Series Data for Machine Learning
In the realm of time series data, the foundation for effective machine learning lies in the quality of the datasets used. This article explores a comprehensive data analysis solution designed to evaluate time series datasets before ingestion into a machine learning model. The solution provides valuable insights into three critical aspects: Target Longevity, Target Significance, and Target Density. Additionally, it includes PACF and ACF plots for advanced time series analysis. The primary objective is not only to decode the charts and plots but, more importantly, to guide users in taking meaningful actions to enhance the dataset's suitability for time series machine learning applications.
Understanding Target Longevity:
The Target Longevity chart visualizes how long each target's data remains active within the time series dataset. To optimize for time series ML, users should focus on:
a. Identifying Targets with Short Lifespans: Targets with a brief data presence may not contribute significantly to long-term predictions. Consider consolidating or excluding such targets to streamline the dataset.
b. Assessing Temporal Patterns: Identify clusters of targets with similar longevity patterns. This insight aids in grouping targets with similar data persistence for tailored preprocessing and analysis. This helps consultants jump-start Rapid Project Experimentation (RPE) to know if they will need to include project segmentation.
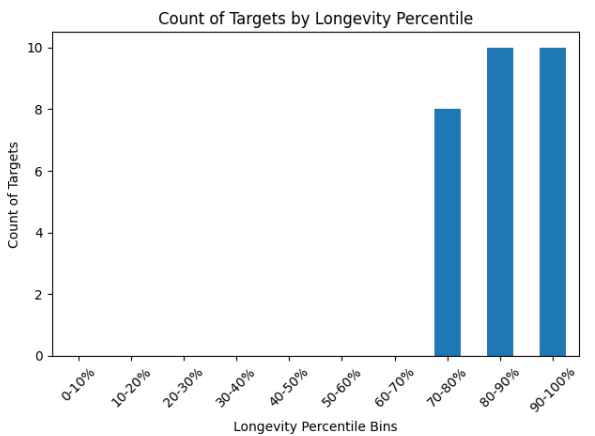
It’s important to have roughly 50% or more of the targets that are above the threshold to unlock ML modeling capabilities within SensibleAI Forecast. Otherwise, the transparency of the forecast is muted.
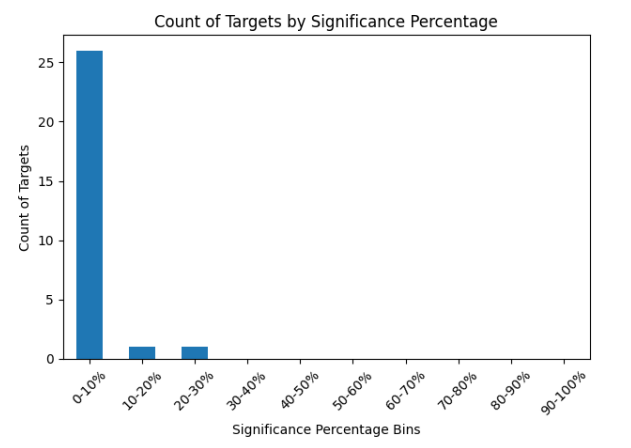
Deciphering Target Significance:
The Target Significance chart gauges the importance of each target within the dataset. To enhance the dataset's relevance for time series ML, users should:
a. Identify High Significance Targets: Focus on targets with high significance percentages, as they contribute more to the overall dataset. Prioritize these targets during feature engineering and model training. The one item an individual should be wary of is that the value column could be misrepresentative of business significance. For example, when dealing with smaller units (like bolts) that are sold in high volume but at a fraction of the cost, consider incorporating unit * price to provide a more contextually appropriate value for each target.
b. Address Low Significance Targets: Evaluate the necessity of low-significance targets. Consider excluding or downgrading less influential targets to optimize computational resources.
Optimizing Target Density:
The Target Density chart reveals the distribution of targets based on their data density. To refine the dataset for time series ML, users should:
a. Identify Sparse Targets: Targets with low-density percentages may lack sufficient data for robust predictions. Consider augmenting sparse targets with additional data or excluding them from the analysis.
b. Assess Uniformity: Evaluate the uniformity of target density distribution. Non-uniform density may indicate data bias, requiring corrective measures for fair model training.
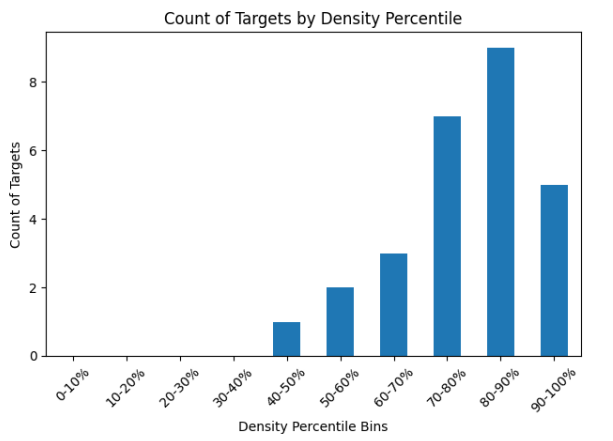
Analyzing this chart in detail could support Project segmentation in SensibleAI Forecast before even running a dataset.
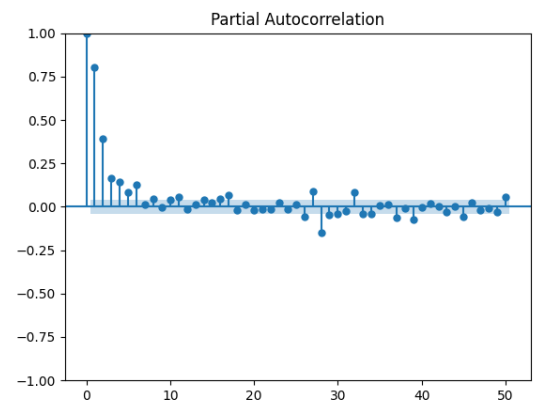
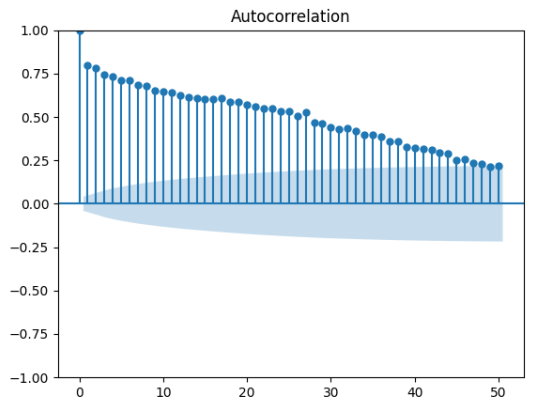
Analyzing PACF and ACF Plots:
The PACF and ACF plots offer insights into the temporal correlation structure of the time series data. To optimize the dataset for time series ML, users should:
a. Ensure Proper Lag Selection: Identify significant lags with high correlation coefficients in both PACF and ACF plots. This aids in choosing appropriate lag values for time series models.
b. Detect Seasonal Patterns: Analyze the ACF plot for periodic spikes, indicating potential seasonal patterns. Incorporate this information into the preprocessing stage for accurate time-series predictions.
By leveraging the insights derived from the presented charts and plots, users can proactively enhance their time series datasets for machine learning applications. Whether it involves consolidating targets, prioritizing high-significance features, addressing data density issues, or discerning temporal correlation patterns, these actions empower users to curate datasets that form a robust foundation for accurate and efficient time series machine learning models. This solution will be iterated on and additional data analytic charts, plots, information, etc. will be provided in the future to help further the pre-processing of datasets prior to Machine Learning.