SensibleAI Studio: ML Clustering 101
What is Clustering?
Machine learning clustering is a technique used to group similar data points together based on their characteristics. One of the most common clustering algorithms is K-means, which partitions data into K predefined clusters. The number of clusters (K) is specified by the user, and the algorithm assigns each data point to the nearest cluster center, ensuring that points within the same cluster are more similar to each other than to those in other clusters. Machine learning clustering partitions data based on their shared attributes and properties. A simple example of clustering is imagining 20 marbles in four different colors—red, blue, green, and yellow. If clustering were applied based on color, the marbles would be grouped into four distinct clusters, each containing marbles of the same color.
How does it work?
Continuing with the marble example, K-means clustering assigns clusters in an iterative approach that randomly chooses four marbles to represent each group as initial centers (since we set K = 4). After picking these centers, the algorithm assigns each remaining marble to the nearest cluster center based on distance (e.g. color similarity). Once all of the marbles have been assigned a cluster, the algorithm recalculates the center by averaging the properties of all marbles in the cluster. Then it reassigns marbles based on their updated nearest cluster center. The algorithm repeats this process until the clusters become stable.
How is K determined?
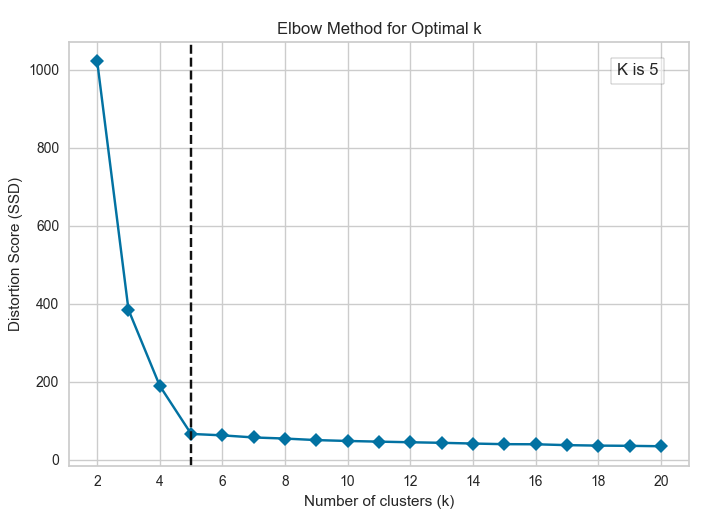
Often, people ask how to determine the value of K when clustering data points that may not inherently appear similar or the number of groups is unknown. The answer is the “Elbow-Method.” The elbow method uses distortion scores to identify the optimal number of clusters. The goal is to find the point on the graph that resembles an “elbow,” where the distortion score decreases rapidly at first but then levels off. Distortion scores measure the sum of squared distances between each data point and its assigned cluster center for a given value of K. In the example, the graph shows a sharp drop between K = 4 and K = 5, then levels off between K = 5 and K = 6. This suggests that K = 5 is the optimal number of clusters, as adding more clusters provides minimal benefits.
What is an example of Clustering?
Clustering can be applied to a variety of problems including customer segmentation. To illustrate clustering, take the example of segmenting jewelry customer based on their age, income, spending score, and savings. The data has the following average values:
| Age | Income | Spending Score | Savings |
|---|---|---|---|
| 59 | 75,513 | 0.51 | 11,862 |
However, the goal is to segment the customers, so K-means clustering will be used to group the data into clusters. The previous section's elbow plot is the elbow plot for this data, so there are five clusters in the data. After running clustering on our five groups, the cluster centroids (the center of each cluster) have the following characteristics:
| Cluster | Age | Income | Spending Score | Savings |
|---|---|---|---|---|
| 0 | 60 | 72,448 | 0.77 | 6,890 |
| 1 | 33 | 105,266 | 0.31 | 14,963 |
| 2 | 24 | 128,029 | 0.90 | 4,088 |
| 3 | 86 | 119,944 | 0.07 | 14,809 |
While looking at the values of the cluster centroids helps to verify that the various clusters do in fact differ from each other, it can be helpful to visualize the clusters. Due to the fact that there are more than three columns, principal component analysis (PCA) can be used to reduce the number of dimensions to two and three to create 2-D and 3-D plots of the data. PCA transforms a dataset into smaller set of variables to capture the most variance possible while minimizing information loss. The images below, also confirm that K-means clustering created five distinct clusters.
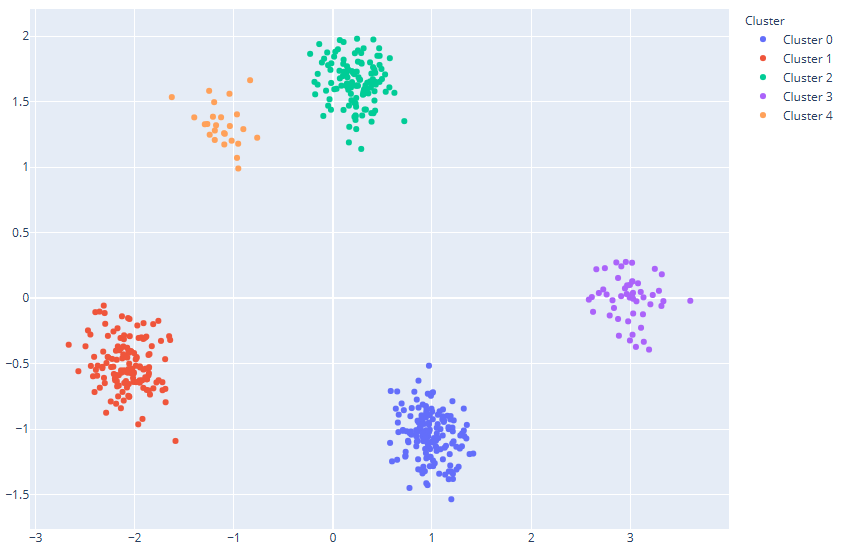 2D PCA Plot
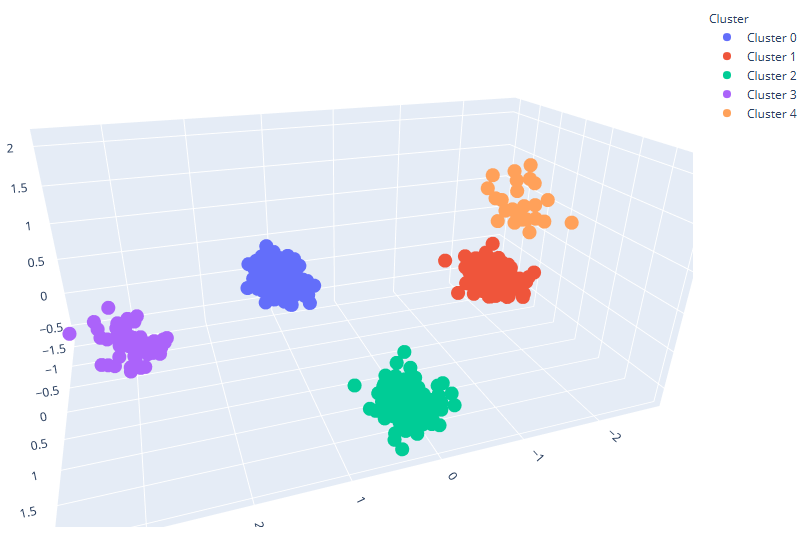 3D PCA Plot
As the graphs and centroids data show, there are five distinct clusters that appear in the data. Looking at the statistics, it appears that clusters 0 and 3 are high spenders, while clusters 1, 2, and 4 are low spenders and have higher savings. Cluster 3 consists of young, high-income individuals with very high spending and low savings, while Cluster 0 includes older individuals with high income and high spending but moderate savings. In contrast, Cluster 1 represents elderly individuals with low income but high savings, while Cluster 2 includes young professionals with high income who prioritize saving overspending. Cluster 4 stands out as elderly individuals with very high income but extremely low spending.
How is Clustering Useful?
Clustering helps businesses uncover hidden patterns and relationships in data by grouping similar data points together. It can make sense of large, complex datasets with multiple variables and observations that otherwise would take hours to analyze manually. By identifying groupings within data, clustering can enhance customer experiences, optimize operations, and improve strategic planning. For example, it can segment customers based on past purchases and behavior, divide sales territories based on buying patterns and market potential, and optimize inventory management by categorizing products according to sales trends and demand fluctuations. Overall, clustering is an effective machine learning technique that can help businesses identify patterns, streamline decision-making, and improve efficiency.