Feature Impact Table Deep Dive
Introduction
The Feature Impact table serves as one of the key pillars of SensibleAI Forecast’s Insights capabilities by providing a way to understand the overall importance that a feature has to a model’s predictions. For each target, we can see in this table what specific features and events have the strongest contribution to what SensibleAI Forecast is forecasting (unit sales, dollar sales, etc.) for each model that uses features. As a business user, understanding that a given event or feature, for example, interest rates, is highly impactful in generating your monthly sales forecast is a powerful insight as you continue forecasting and planning for the future. The following sections explain how Impact Score is calculated and provide best practices for interpreting and applying these insights within your forecasting workflows.
Feature Impact Table Overview
How Impact Score is Calculated
Impact Score is derived from SHapley Additive exPlanations, or SHAP values, which is a concept from cooperative game theory. In the context of a machine learning model, SHAP values represent the contribution of each feature (or “player” in game theory) to the prediction made by the model (the “game”).
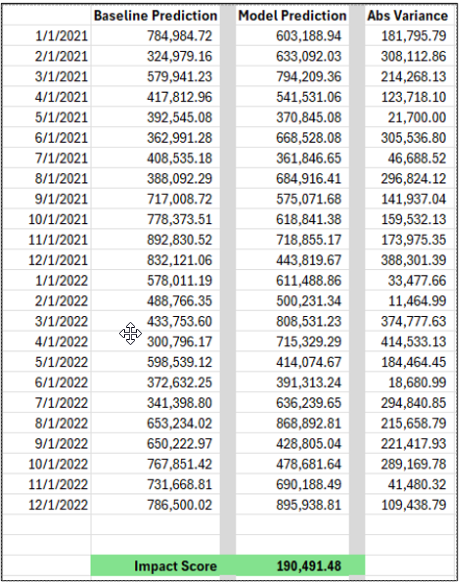
To calculate SHAP values, we start with a baseline prediction that does not consider any features. This baseline is compared against the actual prediction that utilizes all the relevant feature data (such as events and macroeconomic data). SHAP values quantify how much each feature contributes to the difference between the actual prediction and the baseline.
To determine these contributions, we consider all possible combinations of features. For each unique combination, the model makes a prediction, and the contribution of each feature is calculated by assessing how much the prediction changes when that specific feature is added to the combination.
For example, for a given feature called "Interest Rates," the SHAP value is calculated by taking the average of the differences between the model’s prediction for each subset of features without "Interest Rates" and the model’s prediction for each subset with "Interest Rates." This provides a measure of how much the inclusion of "Interest Rates" changes the model's prediction, indicating its contribution. Below is a visual representation of this calculation:
Explaining Impact Score
Let’s say we are forecasting sales dollars and we use a feature called Interest Rates that has an Impact Score of 10,000. To understand this from a business perspective, you could say that on average, Interest Rates are influencing the model’s prediction by 10,000 units compared to what the model would predict without considering Interest Rates at all. Units here is referring to what unit the prediction is in (i.e. sales dollars in this example). It is also important to remember that Impact Scores are model-specific and not meant to be compared across different models.
How Impact Percentage is Calculated
Impact Percentage is calculated for a specific feature by taking the Impact Score of that feature divided by the total Impact Score for every feature of a given model. The total Impact Percentage for all features will always add up to 100%, so this metric is looking at each feature’s share of the total Feature Impact for that model.
Additional Detail and FAQs
Auto-Generated Features
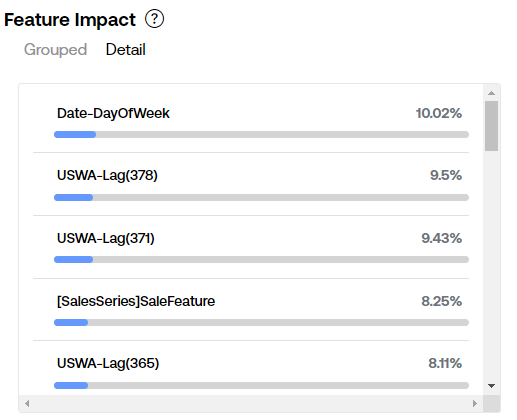
If you run a project without any added features, you may notice that there will still be a Feature Impact table for machine learning models that looks something like this:
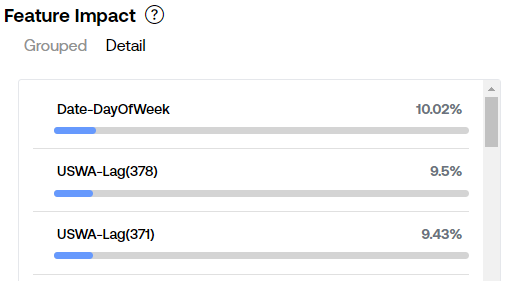
These features are automatically generated by SensibleAI Forecast and used to help the models understand time. Some of the ML models that we use as part of the model arena do not have an inherent understanding of time, so these features are provided to the models to help them order and handle time-based data.
In the case of the feature called Date-DayOfWeek, which helps capture weekly patterns in the data. In the project where the above table comes from, sales were typically very low on the weekends, followed by a massive spike on Mondays, so it intuitively makes sense that DayOfWeek was a highly impactful feature, especially in a project where no external features were included.
The other type of feature in the above table is USWA-Lag(378) (note that Retail is the name of a target, and we are forecasting on a daily level, so 378 is the number of days lagged). This feature simply indicates that the target value being lagged X amount of days is contributing to this specific prediction. The lag is based on whatever frequency you are forecasting at, so it would typically be daily, weekly, or monthly.
Seemingly Unrelated Features Having High Impact Score
When running a SensibleAI Forecast project with a large number of features and events, it is possible that a seemingly unrelated or random feature may have a high Impact Score. Seeing this may confuse users, especially if they do not have a background in data science or analysis.
In the same project referenced above with high weekly seasonality, the holiday Easter kept appearing high up on the Feature Impact table, but based on business knowledge, we know that the holiday itself was not going to impact sales. However, Easter always occurs on Sundays, and as previously mentioned, this business has very low sales on Sundays. Therefore, it appears that the models were likely picking up on this trend happening every Sunday, including Easter, and attributing some of that impact to Easter.
In short, it is possible for a seemingly random variable to have some correlation with the target dataset and have a high impact score despite there being no logical relationship between the two. This is something to look out for when analyzing Feature Impact tables highlights that (1) feature importance should be interpreted cautiously and (2) domain and business knowledge are essential to validate these results.
Conclusion
The Feature Impact table is a powerful tool for understanding the influence of various features on a model's predictions. By leveraging SHAP values, it provides a transparent way to assess how specific events or features contribute to forecast outcomes, allowing business users to gain critical insights that can inform decision-making and strategy. However, it is important to interpret these impacts carefully, particularly when unexpected or seemingly unrelated features show a high impact score. Such occurrences may simply reflect underlying correlations or patterns that the model has detected, rather than direct causal-model relationships. By effectively understanding these nuances, you can help better understand your data and make more informed forecasting decisions.