Forecasting Series: Forecasting Negatives
Author: Hunter Wasserman
Date Created: 4/7/2025
Overview
This article aims to explore the situation when there are negative actuals that need to be forecasted. In this example, the situation is forecasting entire P&L for Cost Center~Account expenses where an expense may be a negative value for one target but positive for another. Below is a walkthrough of the situation, how the issues were identified, and how to rectify these issues.
Problem Statement
You are presented with lots of data in the form of an MS dataset for 2019-2024 ~65 DP max for a target
-
Actuals built on a report of the general ledger
- Target dimensions are Cost Center, Account, Account Section, Account Parent. Unique intersections are Cost Center~Account, as the other two are categorical entities for the Account.
-
Benchmark built on various sheets where granular data is stored from a summary containing aggregation calculations.
The Situation
After initial analysis, it is determined there are negative values in both the actuals and benchmark, however, this is confirmed to be valid as expenses for some accounts may come in the form of negatives or positives, but depending on the account, negatives may mean money out or money in. After further target analysis on density, min and max dates, relationships between hierarchal entities, and aggregate values of targets, you proceed with initial RPE. In this situation, we have project segmentation, and sig target strategies at the on-set due to lack of data. Our build thresholds have all been set to 30 datapoints, and our Model Thresholds for LBMM, Cubist, XGBoost, Catboost, and RandomForest, have all be set to a min threshold of 30 datapoints as well.
Upon creating your first batch of projects, you come across results such as these.
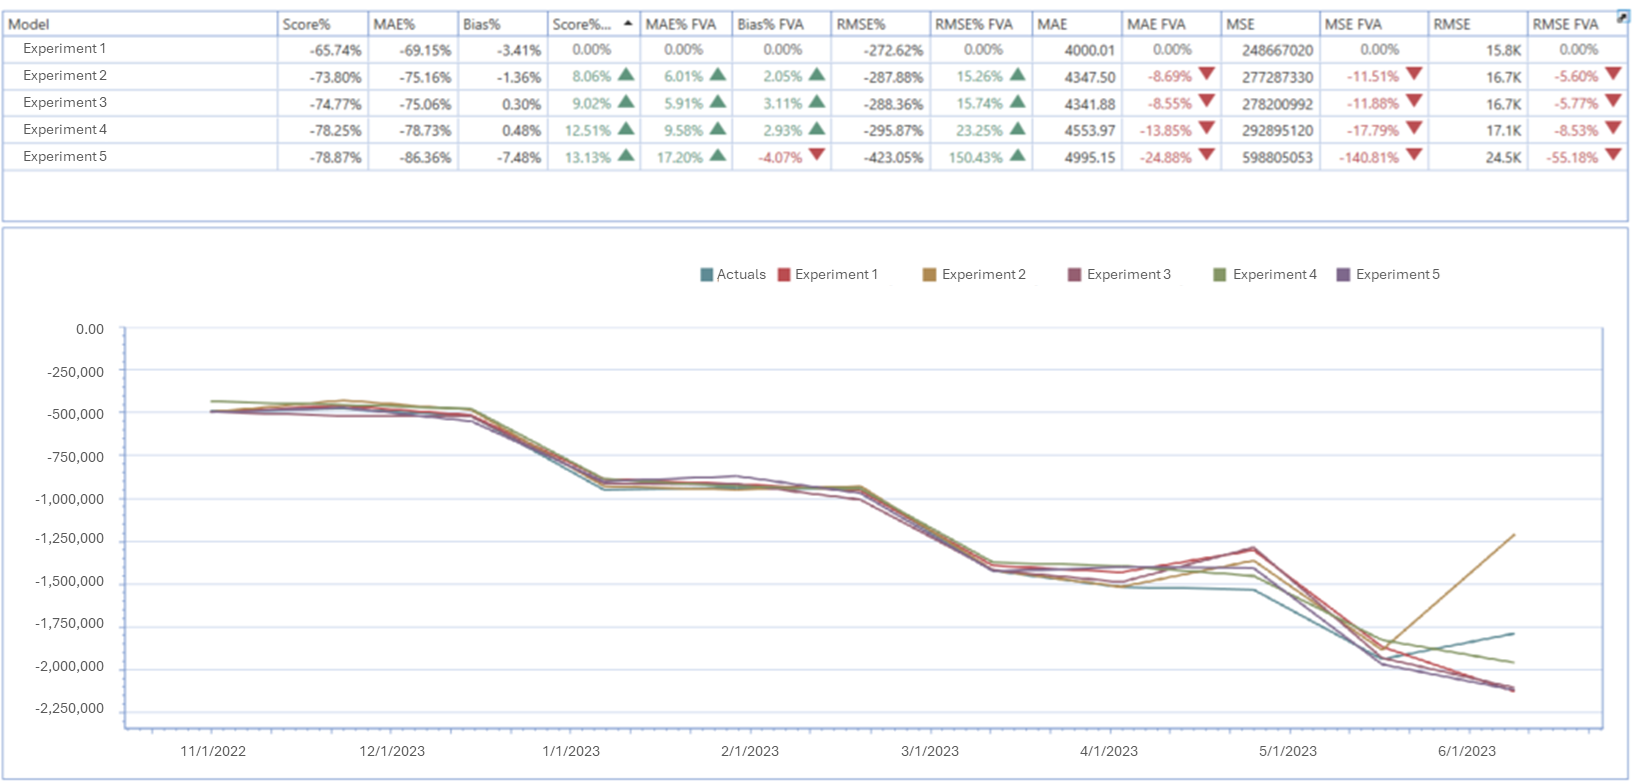
Issues Identified
Some initial observations:
- Forecast is net negative, when we would not expect this.
- Rank of projects shown by Score% looks strange; looking at MAE, the lowest MAEs are considered the worst projects.
- Calculations for Score% and MAE% look strange as well, as it seems the aggregation is occurring incorrectly, resulting in large negatives.
- It would be difficult to read out to an audience how this chart makes any sense, given that the Score% are all negative, and the rank of projects is reversed. Additionally no projects seemingly outperformed the vanilla which is not the expectation, based on the target data analysis.
After diving into the data further, we can see that many targets are yielding net-negative over time, which typically would not make sense. Some accounts are determined to be net-positive. For the purposes of RPE, it would make more sense to forecast for positive net values, and explain that expenses for certain accounts will increase or decrease as opposed to becoming more negative. Additionally, since many of these accounts imply money in and money out does not do the numerical results justice, we have to investigate the target actuals further to understand what is happening at a more granular level.
Resolution - Flipping Targets (Methodically)
For this target dataset, we separately have a summary at the Acccount~Cost Center Level as well as a Cost Center Level summary. We decided to add in median values and a flag that determines if that median is positive or negative. With this information, combined with average and sum values, we could start to understand which targets would accurately be net-negative, or which we should flip to better represent the data before putting it into a project.
Using logic based on the IsPositive Flag per the median value of the target, and combining that with some positive/negative logic on the average value, we can better understand - if we were to flip some targets -which ones to flip, and which to leave alone. We cannot simply flip all targets, and definitely cannot flip negative values to positive ones at the date level.
By using a flag that can tell us which targets to flip and which not to flip, based on positive/negative average and/or median values, we can write a simple query like the one below.
SELECT
  a.[Dimension 1],
  a.[Dimension 2]
  a.Date,
  CASE
      WHEN s.[Is Positive] = 0 THEN a.Value * -1
      ELSE a.Value
  END AS Value
INTO [Destination Table]
FROM [Source Table] a
INNER JOIN [Summary Table] s
  ON a.[Dimension 1] = s.[Dimension 1] AND a.[Dimension 2]= s.[Dimension 2];
Based on your specific data, this may not be a robust solution. The main point here is to dive down deep into your dataset and understand your targets better from the beginning, to see if any target actuals need to be manually altered. It can be a daunting process to change the actuals at the most granular level, but combining analysis of the data with collaboration amongst your team and with the person who originally sent the data can be crucial to understanding the underlying issues.
Results
Below are the steps and results for the process:
-
Flipped specific targets based on some median/avg value logic.
-
Set settings in Configure > Model to allow negative targets (required).
-
Set settings in Dataset Load to update build and model thresholds to handle low datapoint counts.
- This allows us to let features be applied as needed or unlock ML models (optional).
-
Dataset still contains negative and positive values, as well as negative and positive targets, but targets that should be flipped based on how expenses of account work are flipped correctly to reflect accurately.
- This is because in a ledger account can often display negatives and positives in a confusing way.
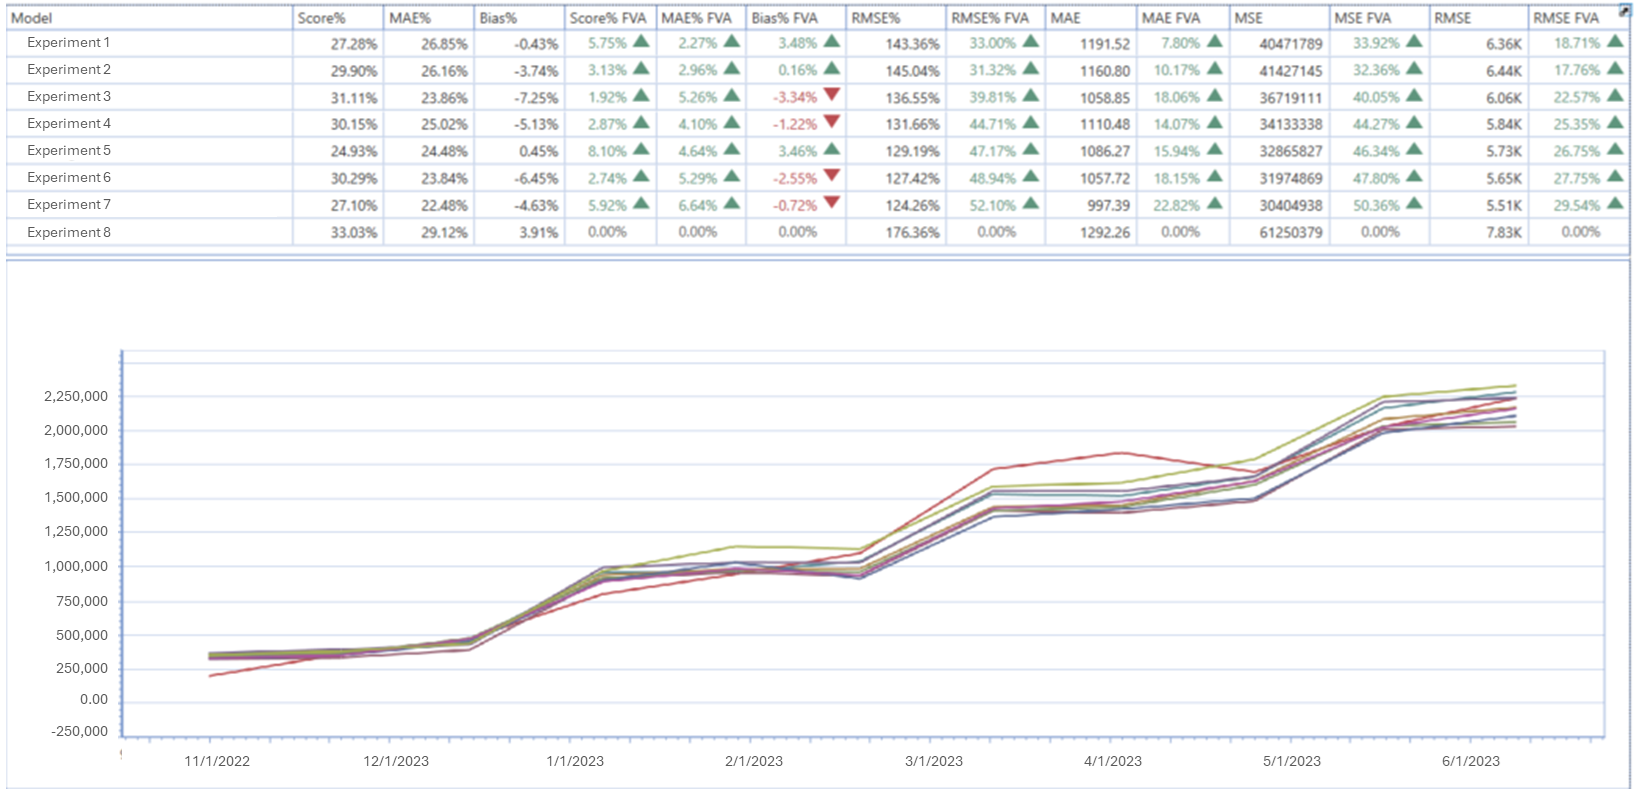
This makes a lot more sense as the company is expected to grow in dollars over the years; not lose money. Additionally, we would expect to explain that expenses grow or decrease, not that they go more into the negative. Lastly, the list at the top now performs the value calculations correctly now that it does not have to divide by negatives when creating metrics like MAE% or Score%.