Prediction Summary Web Dashboard User Guide
Purpose
The purpose of this document is to act as a user guide for the prediction summary web dashboard. This dashboard appears in two different places of SensibleAI Forecast - the Model Build → Pipeline → Arena page and the Utilization → Analysis page. There are slight differences in terms of what the dashboard will be display based on which point of entry is utilized, but the use of this dashboard is very much the same. Note: this article was written for the XPFv4.0.3 release. While much of the functionality is the exact same for versions 4.0.0-4.0.2, there are certain differences in functionality across the versions. Those are generally called out in the article below, but please be mindful of this fact when reading.
Initial Load
To load the prediction summary web dashboard, select a target from the Targets pane on the left hand side of the page.
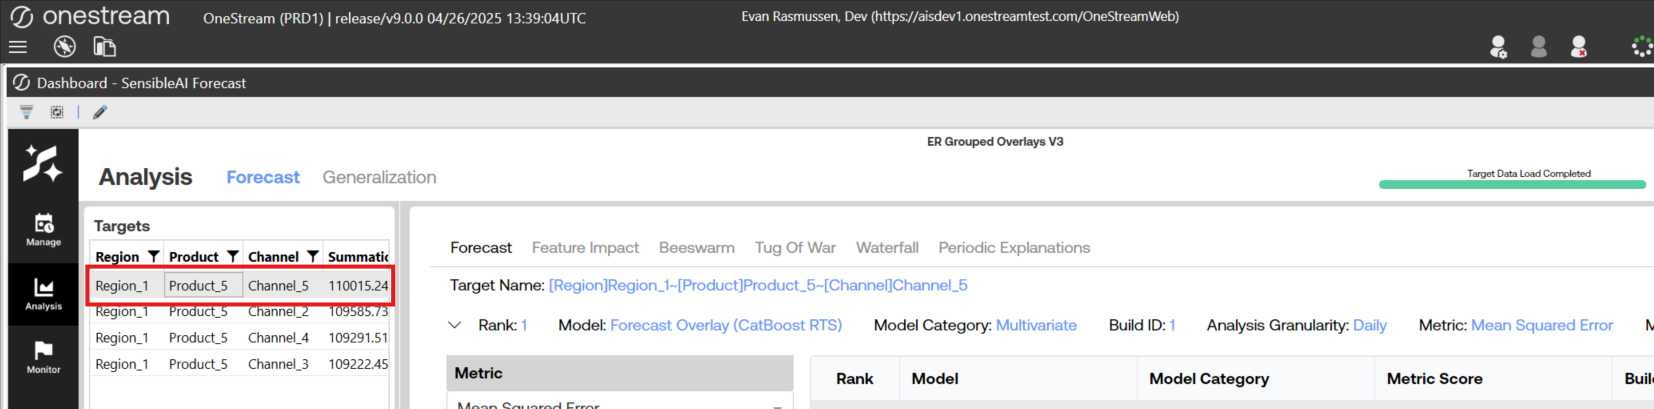
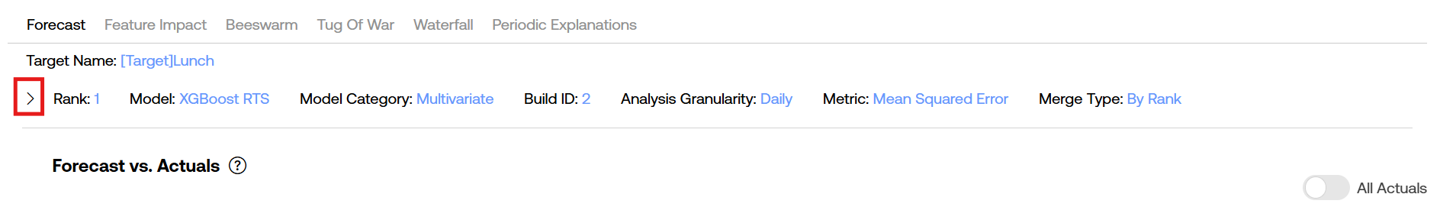
Users will then see the prediction summary web dashboard for the specified target. Along the top, you will notice 4 navigation items if viewing the Model Build version of the dashboard, or 6 navigation items if viewing the Utilization version. Underneath the navigation bar is a set of dropdown boxes containing configurable options, the model arena table displaying the deployed models for the target, and a header displaying the current selections of the dropdowns and model arena table. Users may collapse the dropdowns and arena table by clicking on the caret icon outlined in red below.
Model Arena Table
The model arena table is populated with all of the deployed models models for the specified target.
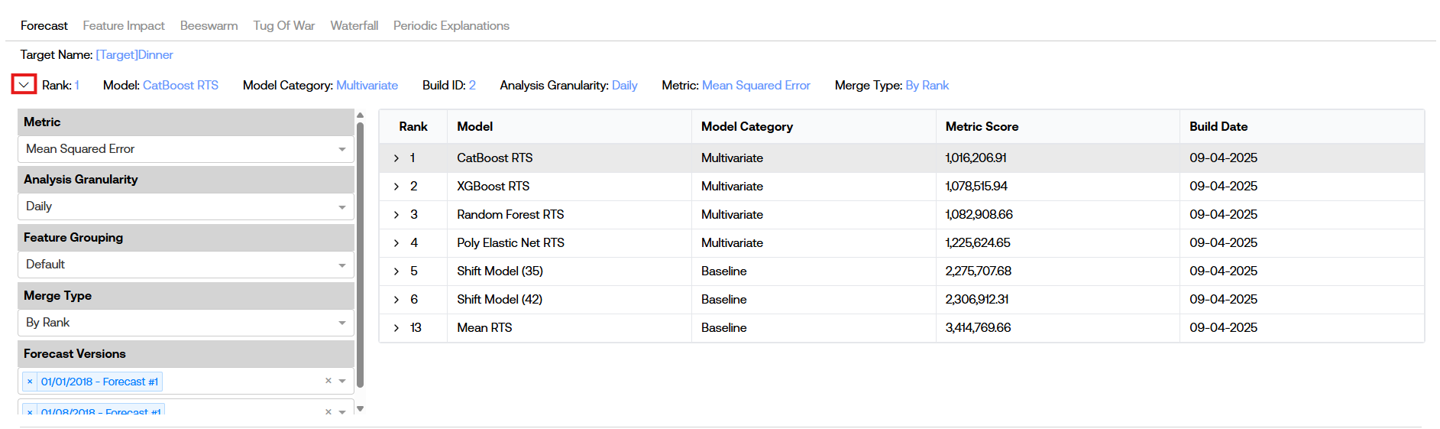
The Rank column displays the value of the rank of the model determined during the Pipeline job. In the example above, you may notice the model ranks include 1-6 and then skips to 13. This occurs because the models ranked 7-12 were not deployed.
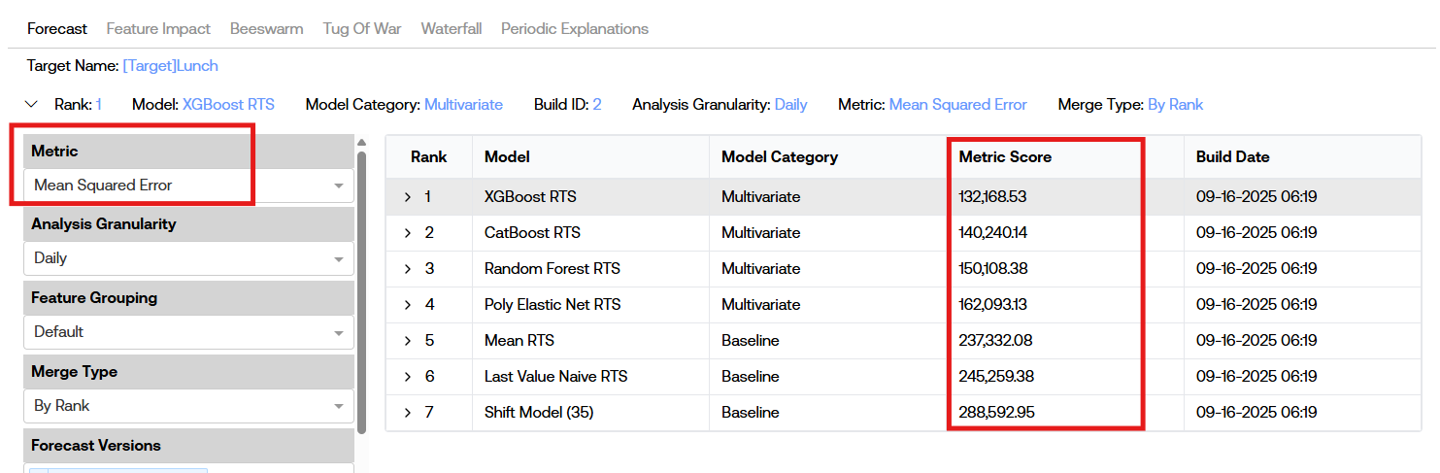
The Metric Score column displays the error of the model where the actual error metric utilized is determined by the selection of the Metric dropdown from the left hand side. By default, the option chosen in the Metric dropdown is the one selected for the project configuration during the Model Build phase. Changing the Metric dropdown value will in turn change the Metric Score values show in the model arena table to be the model’s metric value determined during Pipeline.
The Build Date column displays the date that the build including the given model was created. The model arena table includes models from all prior deployed builds. The most recent build’s models will be shown at the top-level of the model arena table, with prior builds' models being shown underneath each of these (if prior build exist). Note: on version XPFv4.0.0-v4.0.2, the Build Date column is not present and instead the Build ID is shown.
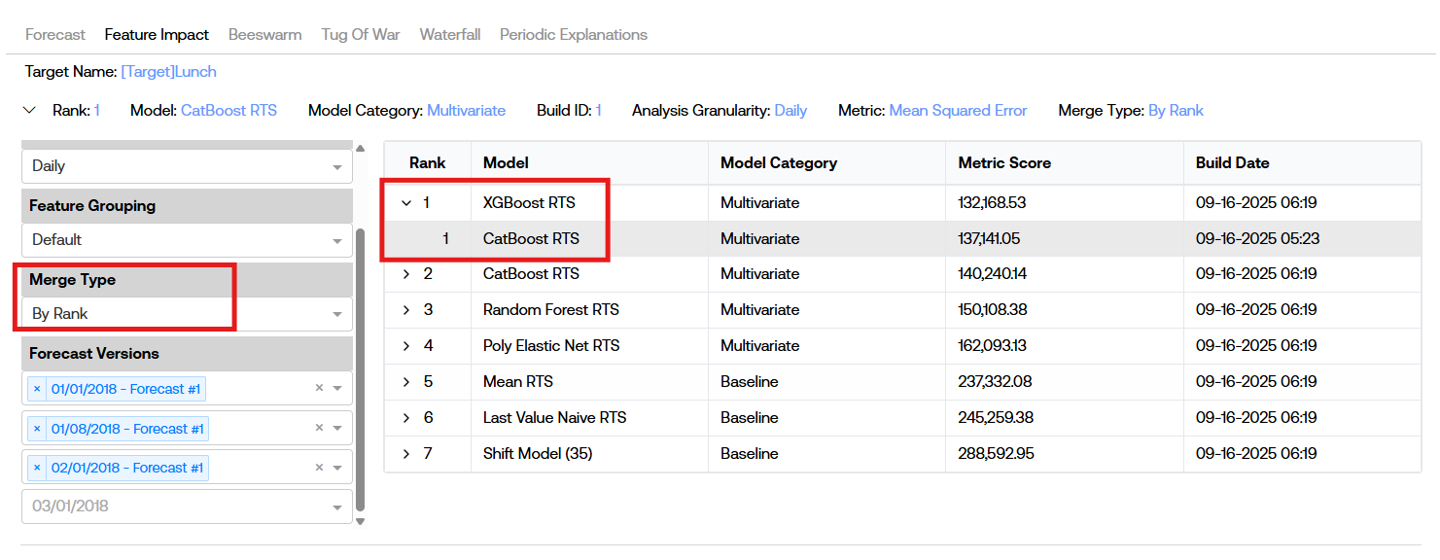
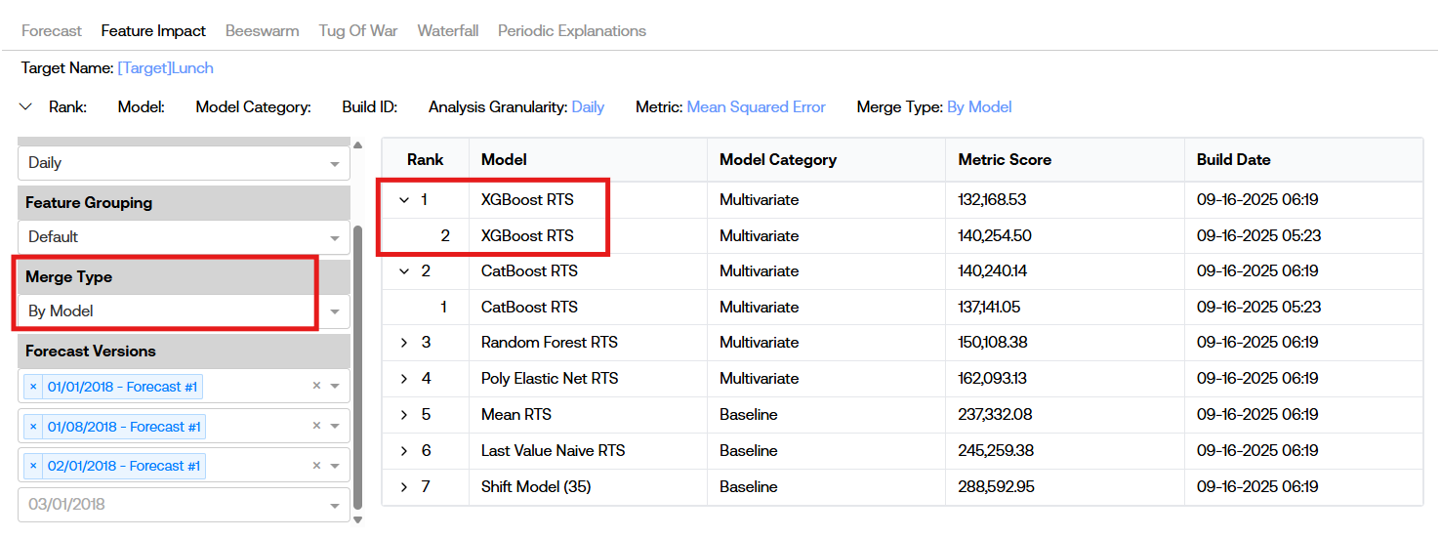
The models from prior builds that appear underneath the current build’s models are determined by the Merge Type dropdown on the left-hand side. Selecting a Merge Type dropdown value of “By Rank” will join the models across builds based on the models' ranks. This means that clicking on the caret icon of the row of the model arena table with Rank = 1 will display the models from prior build(s) that were also Rank = 1, regardless of the type of model utilized. Contrarily, selecting a Merge Type dropdown value of “By Model” will join the models across builds based on the models' name. This means that clicking on the caret icon of the row of the model arena table with Model = “CatBoost RTS” will display the models from prior build(s) that were also Model = “CatBoost RTS”, regardless of the rank of the CatBoost model (it may have been Rank 1 in the first build but rank 3 in the second build, for example). It is important to note that the currently deployed build’s models drive what prior build models may be shown. To clarify, please consider the following hypothetical situation:
My first build utilized forecast overlays, and my top ranked model is “Forecast Overlay (XGBoost RTS)”
I run a rebuild on the project, this time without forecast overlays turned on, and my top ranked model is “XGBoost RTS”
I load the prediction summary web dashboard in the Utilization section, and have my Merge Type set to “By Model”
Because there is guaranteed to be no “Forecast Overlay (XGBoost RTS)” from my most recent build, I will not be able to see this model anywhere in the model arena table
However, when I switch my Merge Type to “By Rank”, I will be able to see the “Forecast Overlay (XGBoost RTS)” by expanding the top ranked “XGBoost RTS” from my most recent build because this model was the top ranked model from the prior build
Dropdowns
Depending on whether the prediction summary web dashboard is being viewed from the Model Build stage or from the Utilization stage, you will see 4 or 5 dropdown options to the left of the model arena table. This section explains what each of those options represent, what they affect, and how they are initially populated with values. Please note that hovering over each of the dropdown titles will generate a tooltip with additional context about each option.
Metric
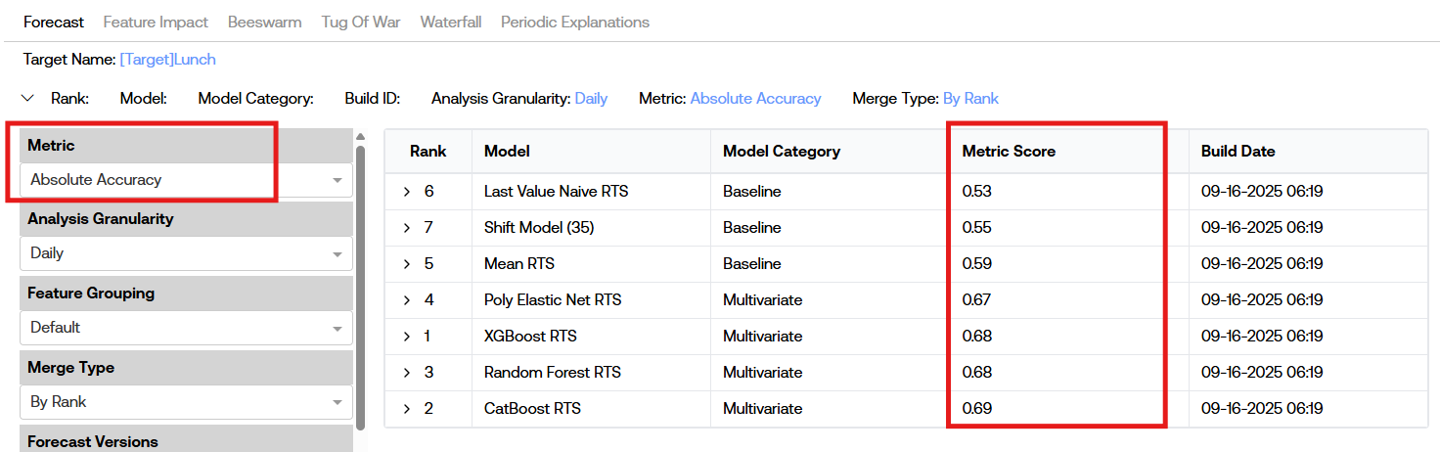
The Metric dropdown holds 8 different options to analyze model performance against different error metrics. The default value of this dropdown is the value set during for the project during Model Build (on XPF version 4.0.3 or greater, on 4.0.0-4.0.2 it is Mean Squared Error). The value of this dropdown changes two different items: the “Metric Score” column of the model arena table, and the “Metric” values of the time series graph on the “Forecast” page. In the latter, the error metric values are calculated on a datapoint-by-datapoint bases for each forecast value when compared to an actual value, which is not the same as the single metric value displayed in the “Metric Score” column of the model arena table. Due to this fact, certain datapoint-by-datapoint calculations of error metrics do not actually work depending on the selected Metric option. Please see tooltips for more description on which this may be relevant for. Changing this dropdown value will also change how the model arena table is sorted, meaning the “Rank” column may not be in incrementing order if this value is changed. The only affected by altering this dropdown value is the Forecast page.
Analysis Granularity
The Analysis Granularity dropdown holds at most 5 different options for time granularity (Daily, Weekly, Monthly, Quarterly, and Yearly). The originally selected value is the granularity of the project’s source data. There is no ability to select a more granular option than the project’s source data. For example, if I have monthly source data, the only options in my dropdown will be Monthly, Quarterly, and Yearly. Changing this value will update the time series visuals shown on the Forecast page, the Feature Impact page, and the Tug of War page by aggregating the values to the new granularity. Simple summation is completed for the Forecast and the Tug of War pages, while the aggregation method utilized on the Feature Impact page is entirely dependent on the actual feature being selected to view.
Feature Grouping
The feature grouping dropdown currently has one possible option: “Default”. This dropdown determines how features are bucketed into groups within the Feature Impact page, the Waterfall page, and the Periodic Explanations page.
Note: groups for grouping + forecast overlays projects on XPFv4.0.0 - XPFv4.0.3 may not behave as expected. Certain “Lag” features are bucketed into the “Other” category rather than the more expected “Lags” bucket.
Merge Type (Utilization Only)
The Merge Type dropdown is populated with two options: “By Rank” and “By Model”. This selection affects how children rows of models from prior builds are linked to parent builds from the most recent build on the top level of the model arena table. This only has any notable affect with there have been multiple builds for the project and it is in the Utilization phase. See the description on By Rank from the (XPF) Prediction Summary Web Dashboard User Guide | Model Arena Table section for more detail.
Forecast Versions (Utilization Only)
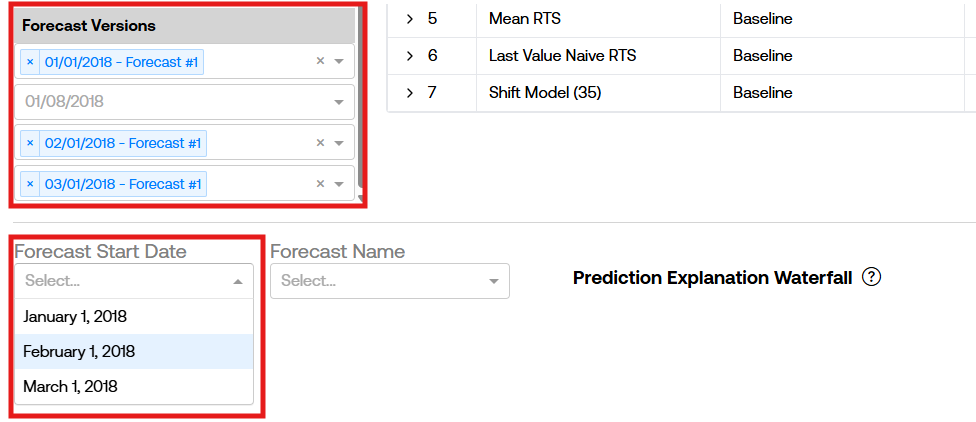
The Forecast Versions dropdown is a series of several different dropdowns. There is one dropdown for each forecast start date of predictions that have been ran, with each dropdown having options for the scenario names that were utilized in those predictions. By default, the selected forecasts versions are the most recently run scenario for all forecast start dates. Changes to these dropdown values will affect the following pages in the following ways:
-
**Forecast page: all selected forecasts will display the corresponding selected model’s forecast values in the time series visualization. If there is overlap in the forecasts (two separate predictions with one month long forecast horizons generated one week apart, for example), and both are selected from the dropdown, the most recently created forecast will always be the one displayed over any prior forecasts. If users wish to see the full forecast from prior predictions without taking the overlaid most recent ones, they may un-select the most recent ones from the dropdowns on the left-hand side.
-
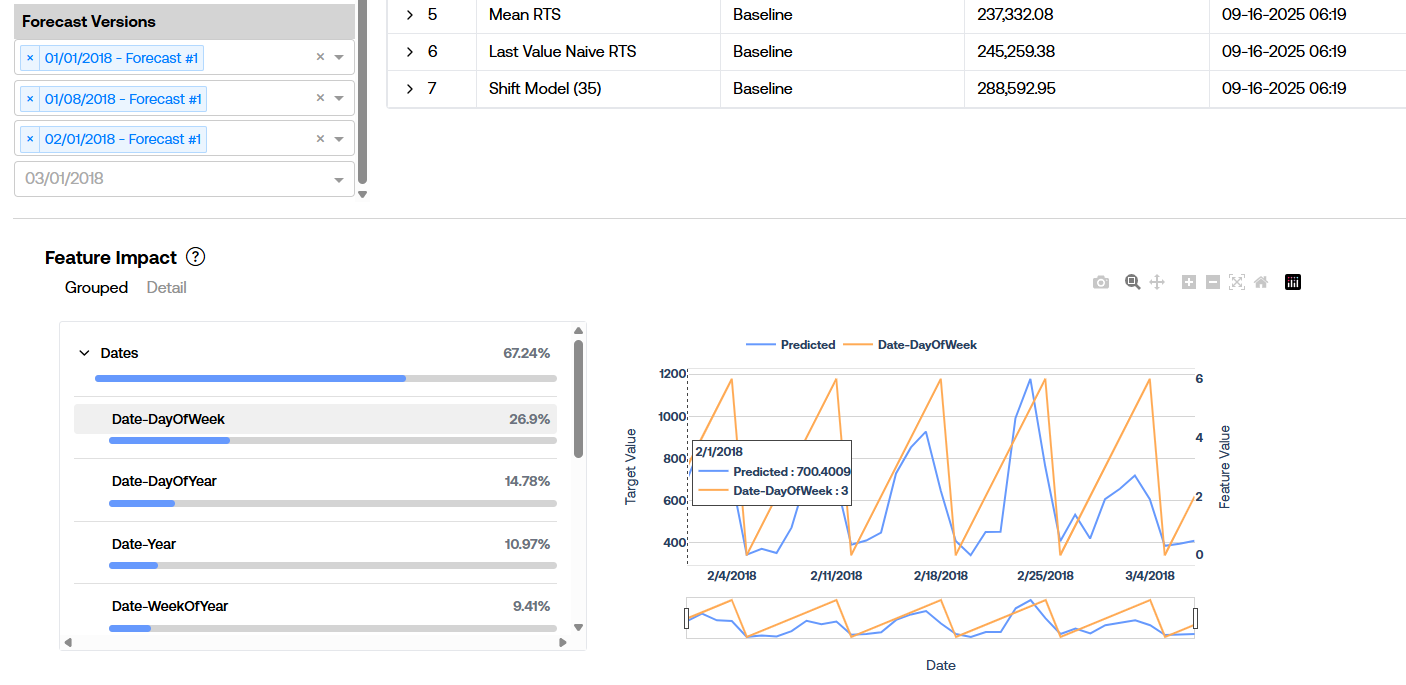
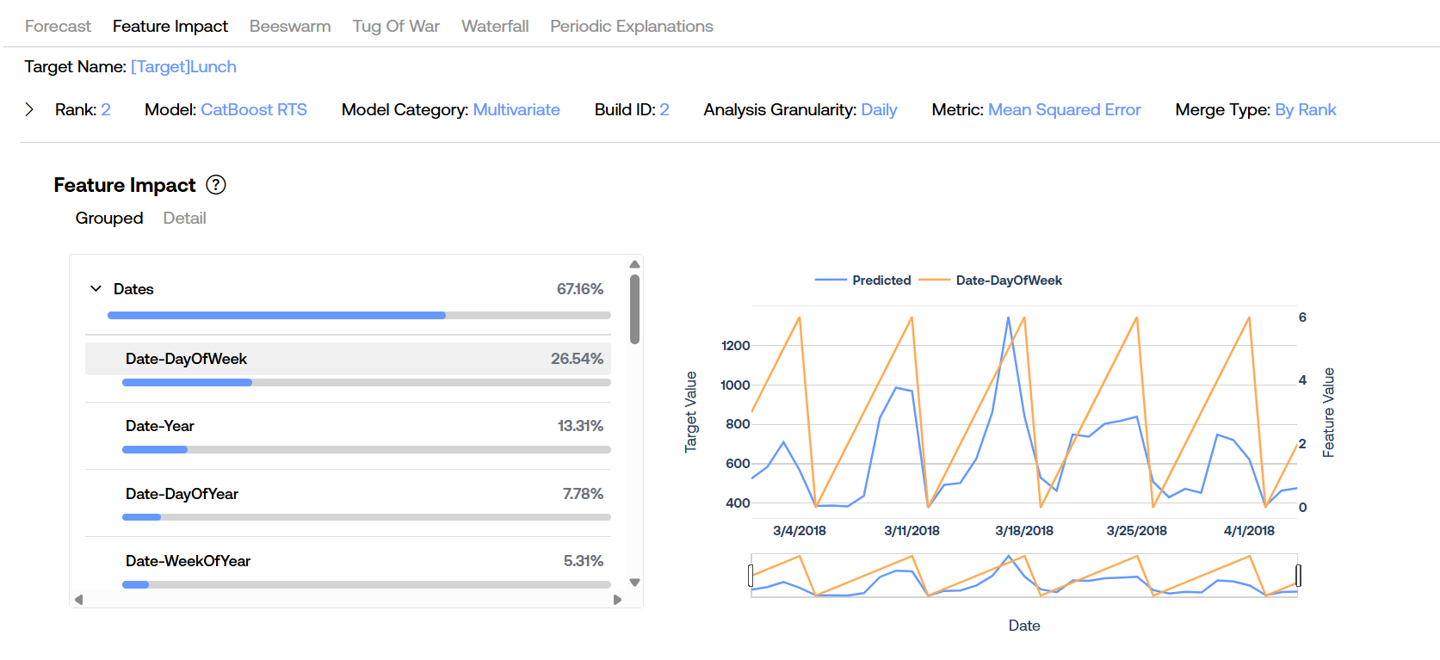
Feature Impact page: there is no change in the feature impact data but one minor one with the corresponding time series visualization with varying Forecast Version selections. The feature impact statistics are calculated once during pipeline, and will be updated during a rebuild, so both the Grouped and Detail feature impact values are static in that regard. However, when clicking on a feature name from the table on the left of the Feature Impact page, the raw feature values are displayed to the right in a time series visual overlaid with the predictions from the most recent forecast. As a clear example of this, take a look at the following image. The latest Forecast Version selected starts on Feb 1, 2018, but there are selections of forecasts from Jan 1, 2018 and Jan 8, 2018. The visual on the right displays the predictions from the Feb 1, 2018 forecast overlaid with the Day-DayOfWeek feature values across that same time range.
-
Beeswarm page: each individual point on the beeswarm visualization represents an individual prediction value. Therefore, including more Forecast Versions will simply increase the number of datapoints shown in this visual.
-
Tug Of War page: similar to the Forecast page, the Tug Of War page’s visual will include data from all of the selected Forecast Versions. Again, overlap in prediction values will result in the latest prediction value being displayed.
-
Waterfall page (Utilization only): the Forecast Versions dropdown will only affect the options for the next dropdown to select a single forecast. The Waterfall plot must be specific to a single forecast, so additional filtration needs to be made prior to viewing the visual.
-
Periodic Explanations page (Utilization only): this behaves in the exact same way as the Waterfall page. The Forecast Versions dropdown will only affect the options for the next dropdown to select a single forecast. The Periodic Explanations plot must be specific to a single forecast, so additional filtration needs to be made prior to viewing the visual.
Model Stage (Model Build Only)
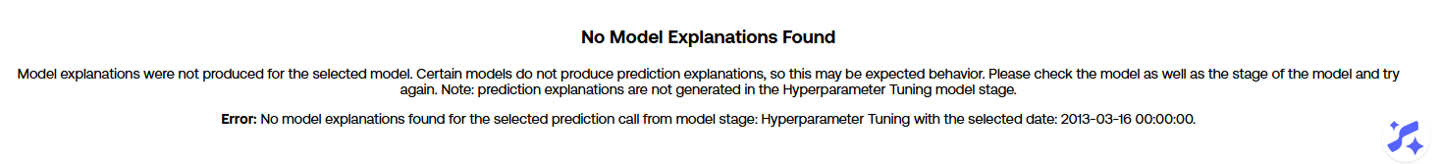
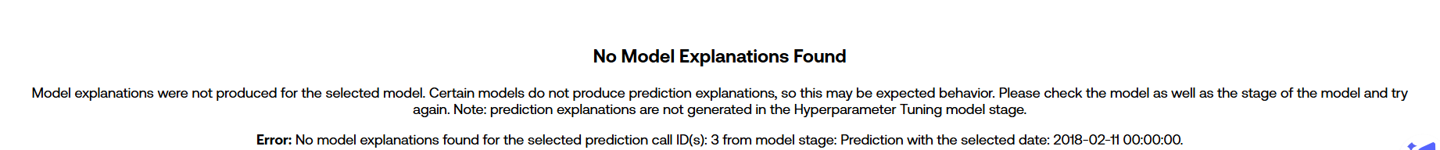
The Model Stage dropdown is only present in the Model Build phase of a project. This selection determines which splits of data to analyze in each of the respective pages. The options here will always include “Hyperparameter Tuning” and possibly “Model Selection” and “Hyperparameter Holdout Backtest”. Please note that there are no prediction explanations generated during the “Hyperparameter Tuning” phase, so many visuals may not display certain data you may expect. In such cases, friendly warning messages will display to let users know this is the case:
Dashboard Pages
There are 4 viewable pages when interacting with the dashboard in the Model Build phase and 6 viewable pages in the Utilization phase. The model arena table and dropdown options are viewable along the top section from all pages. In order to view the core content of any of these pages, a model must be selected from the model arena table. Users have the ability to collapse and hide the model arena table by clicking on the caret towards the top left hand side of the page.
Forecast
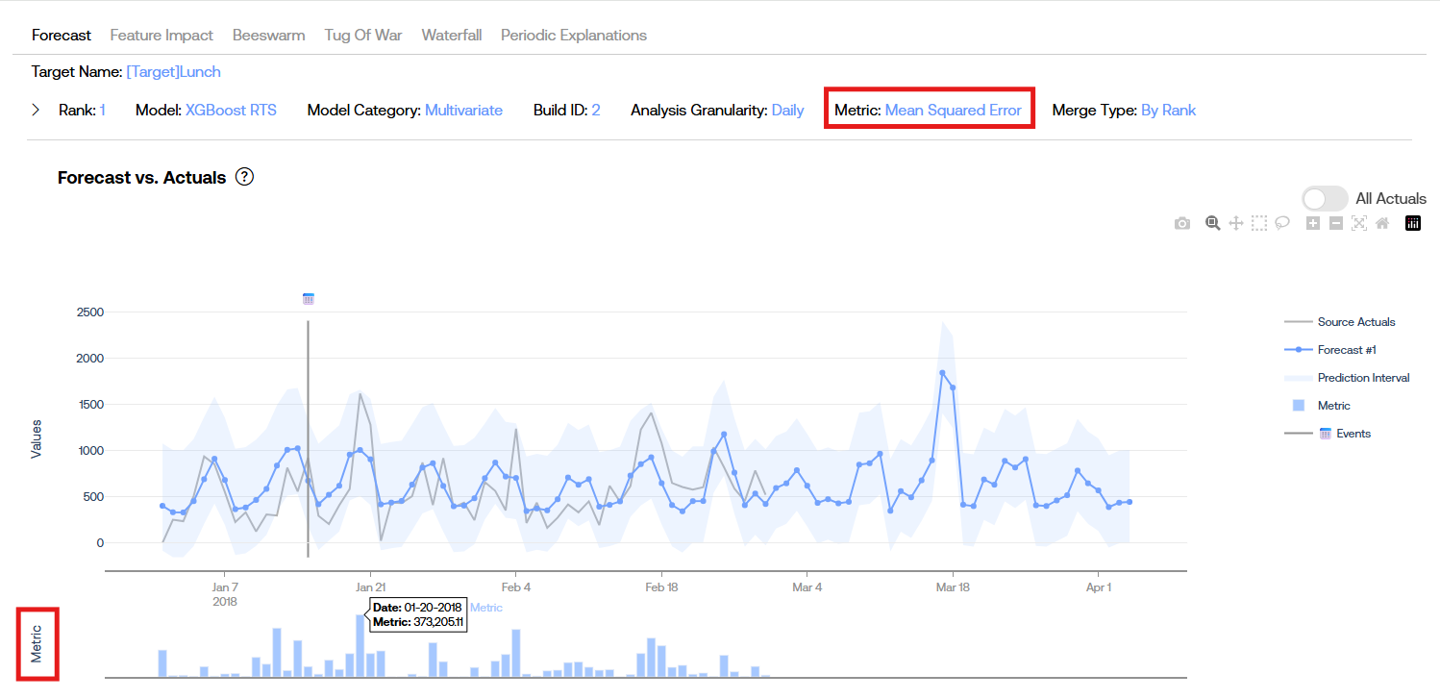
The core component in the Forecast page is the time series visualization of predicted values and actual values.
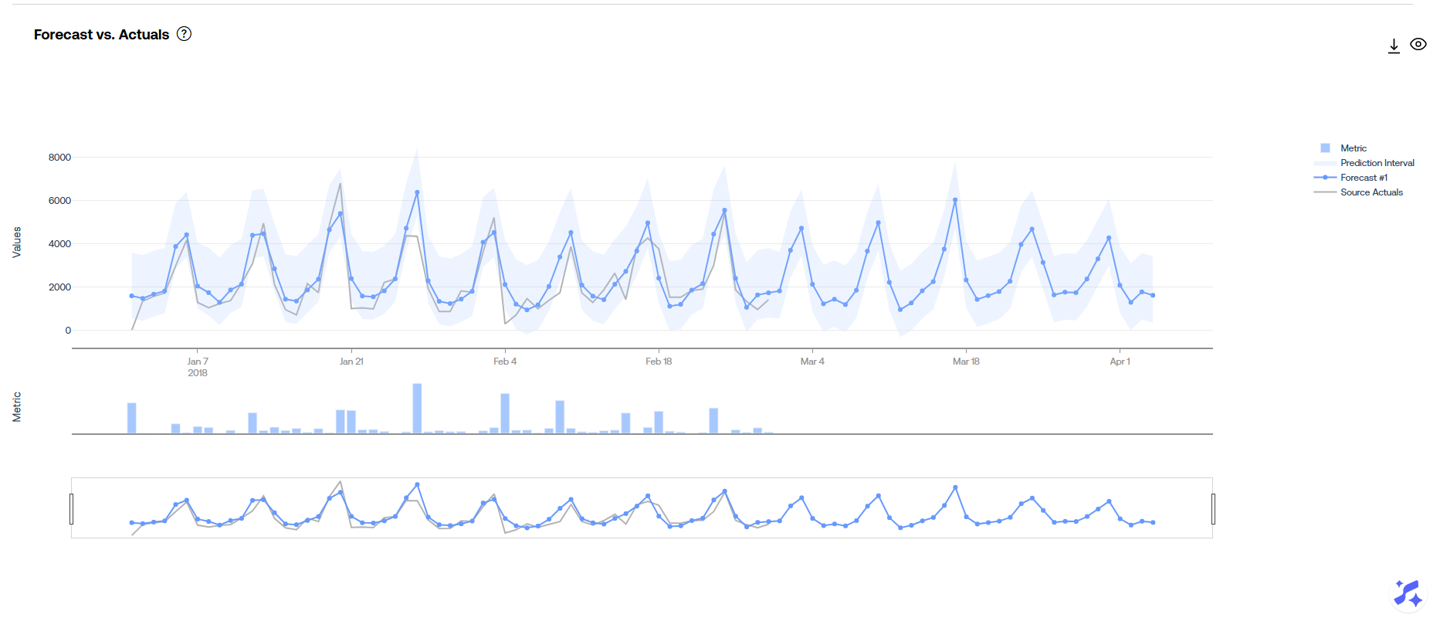
Predicted values from all selected Forecast Versions will be displayed in this visual. If there is an overlap in predicted values (two different forecasts with the same scenario name generating predictions for the same date), then the prediction values with the later forecast start date will be displayed in the visual and the prior ones are hidden.
Predictions from multiple different models may appear in this visual if the project is in Utilization and has been rebuilt. Build dates are identified in the visual with a horizontal line.
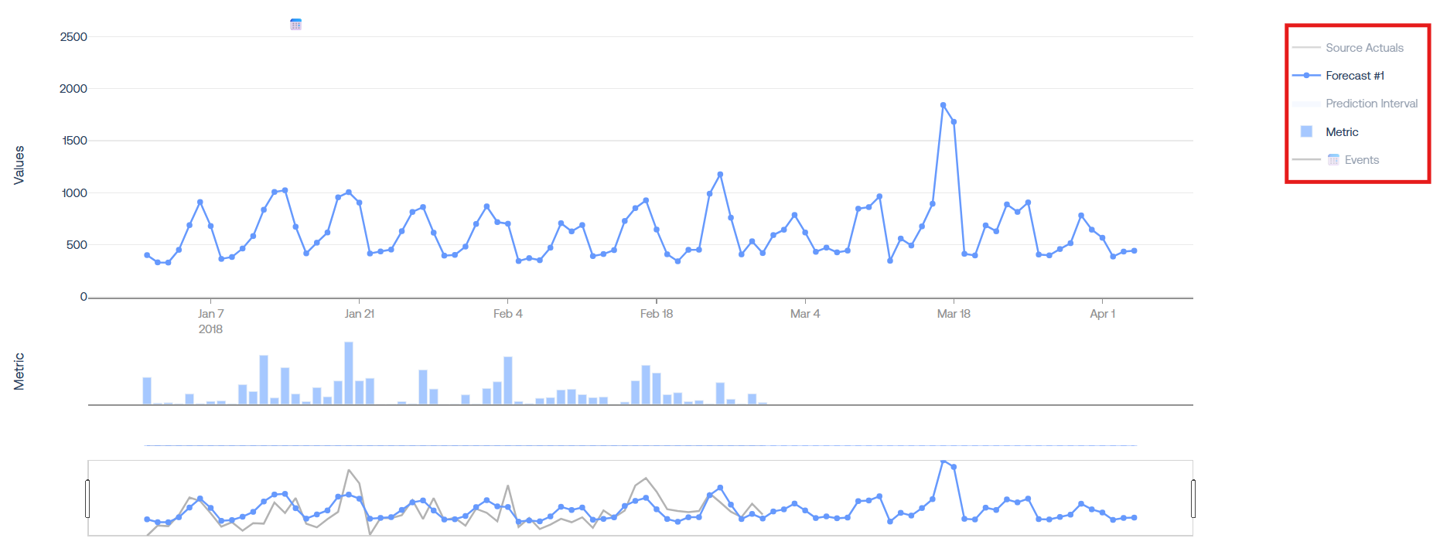
Clicking on values from the legend on the right-hand side of the visual will remove the respective items from the visual:
The Metric subplot below the main visualization shows the individual prediction’s error value, determined by the selection of the Metric dropdown.
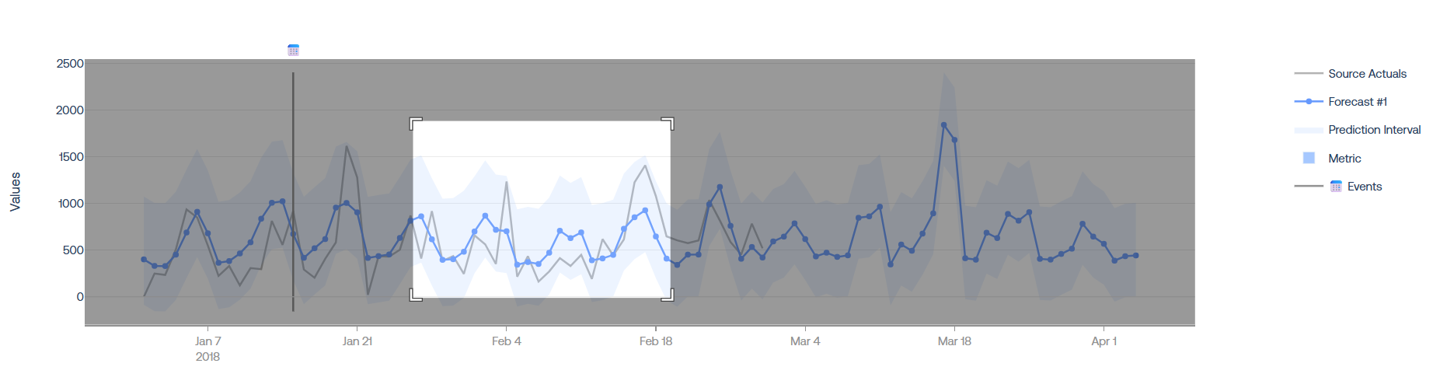
The range filter at the bottom of the plot may be used to zoom in to specific time windows. Similarly, users may click and drag to create a box around a specific window to zoom into:
There are a handful of other options to zoom, download a .png, pan, and more by clicking on items in the top-right of the visual:
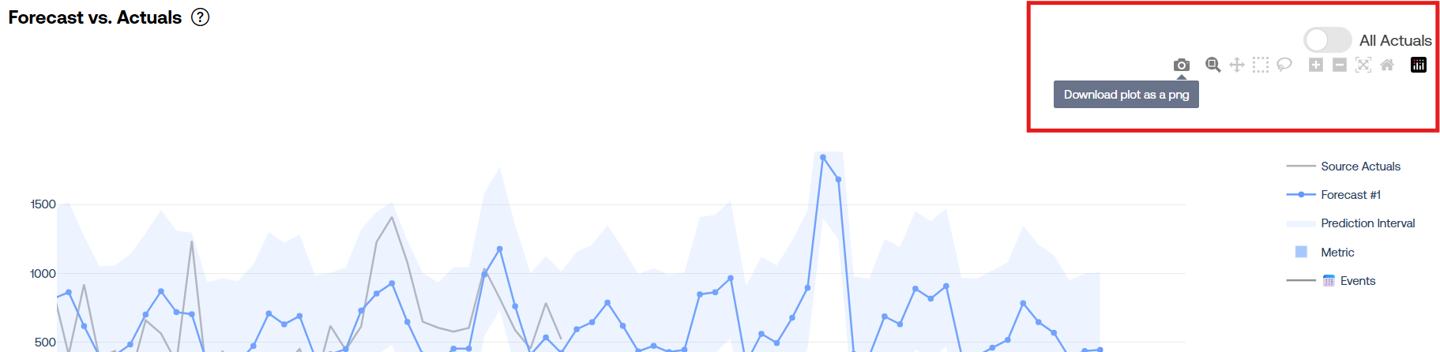
Users may also retrieve all prior actuals and include the in the visual but clicking on the “All Actuals” seen in the top-right hand side.
A secondary component may be generated by clicking on a prediction value from the time series visual. This plot contains the prediction explanations and feature values that drove the individual predicted datapoint.
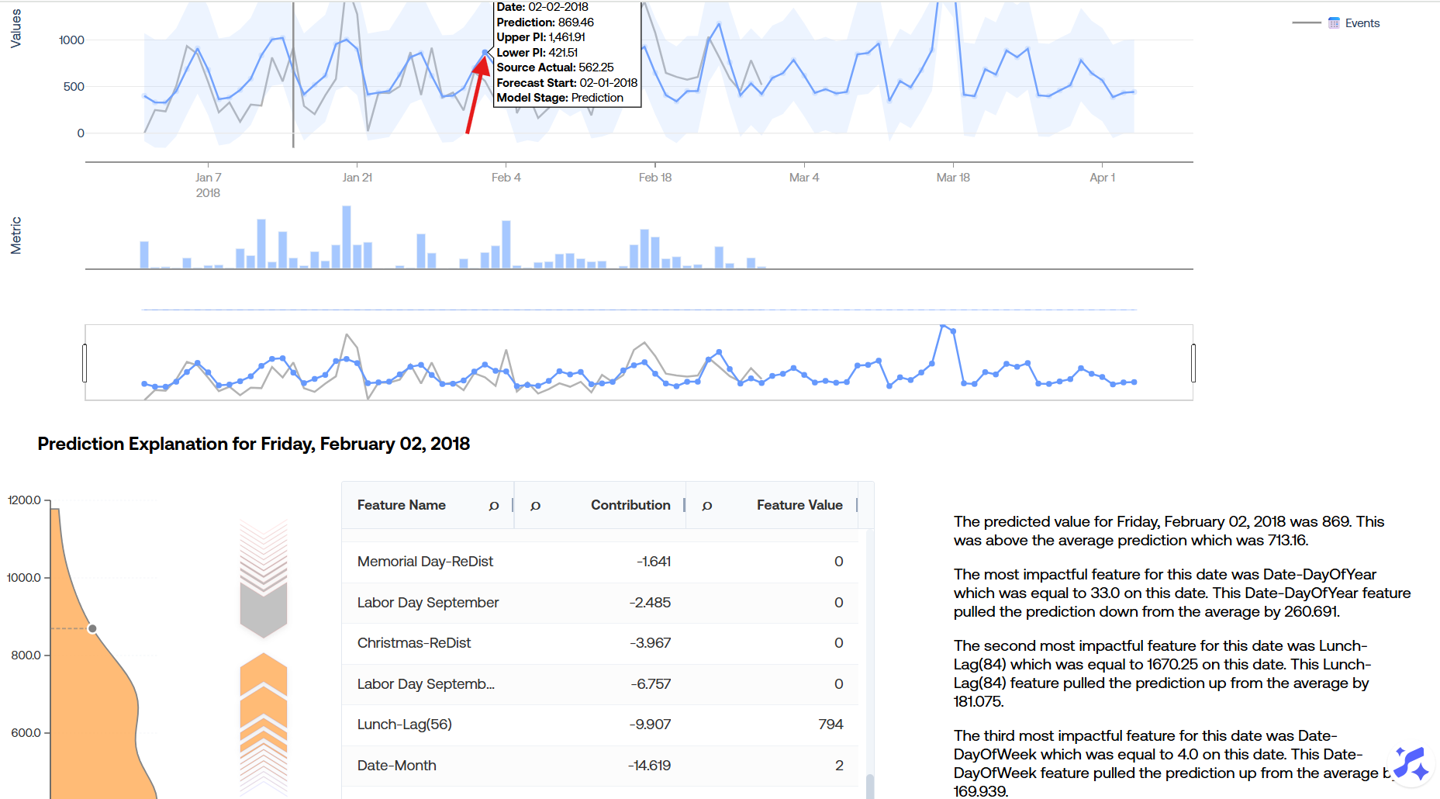
The first visual on the left-hand side of this component is a kernel density estimation plot that summarizes the spread of all prediction values from the given model, including the location of the prediction value that was selected relative to all of the model’s predictions.
Next comes a push-pull graph portraying the positive and negative contributions for the given prediction. This visual is similar to an individual horizontal stacked bar of the Tug of War page. To the right of this visual is a table containing the underlying information that drives this push-pull visual. Clicking on an item of the push-pull visual will locate and highlight the corresponding row in the summary table. Finally, there is a brief summary of the top three contributions in natural language.
Please note that statistical and baseline models will not produce prediction explanations, meaning the resulting component will show an error message like so:
Feature Impact
The Feature Impact page shows the impact percentages of features for the given model, signifying which features and groups of features have the most significant impact on prediction values. The feature impact statistics are calculated once for a given model during the pipeline job, meaning they will not change for a given model unless a rebuild is run.
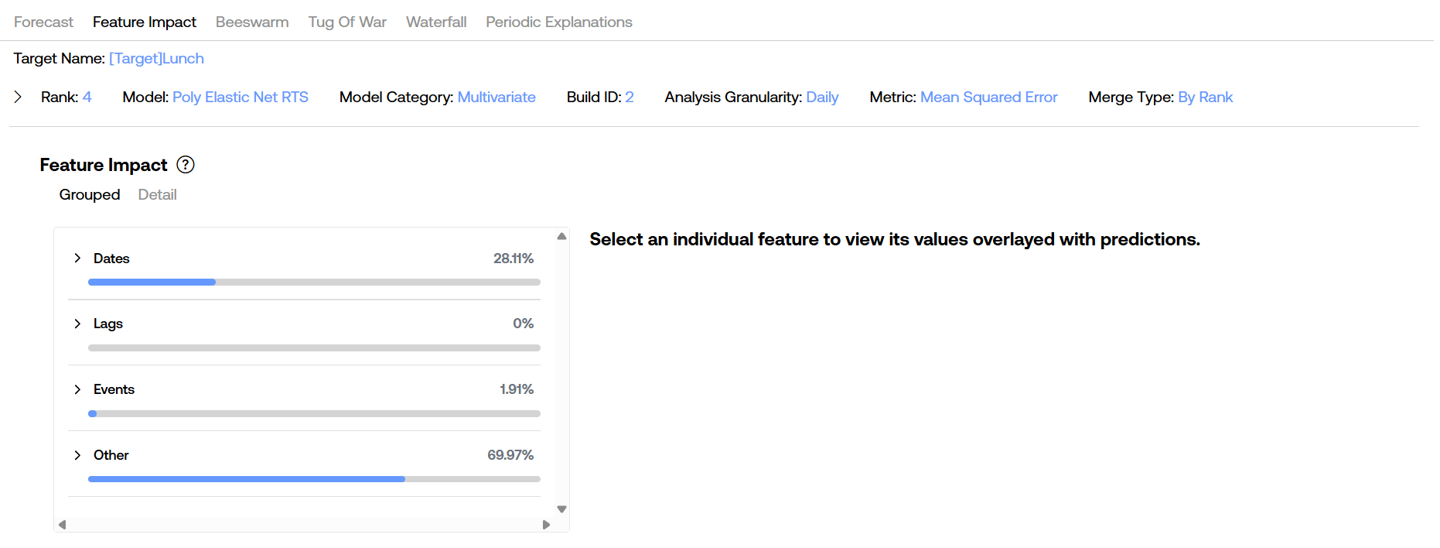
The Grouped selection will bucket the features into four categories as shown by the image above. These buckets can be further expanded to view children of the respective hierarchy. The buckets are determined by the Feature Grouping dropdown option (“Default” is the only option on XPFv4.0.0 - v4.1.0, more options will be brought in the future). Users may expand the groups on the left to see children groups and individual features along with their corresponding impact percentages.
The Detail selected will show each individual features without any groupings sorted by the most impactful ones first.
Users also have the ability to view actual feature values overlaid with prediction values by clicking on a single feature row from the table on the left. Upon selection, prediction values from the most recent forecast selected from the Forecast Versions dropdown are fetched and displayed alongside the values of the given feature for the same time period.
On XPFv4.0.0 - v4.0.3, certain ML models like Poly Elastic Net do not have the ability to display feature values in the plot along the right-hand side.
Additionally, for the same Poly Elastic Net model on XPFv4.0.0 - v4.0.2, clicking on the Detail button appears to have no affect and users can only view the Grouped impact percentages. This is resolved on XPFv4.0.3.
Beeswarm
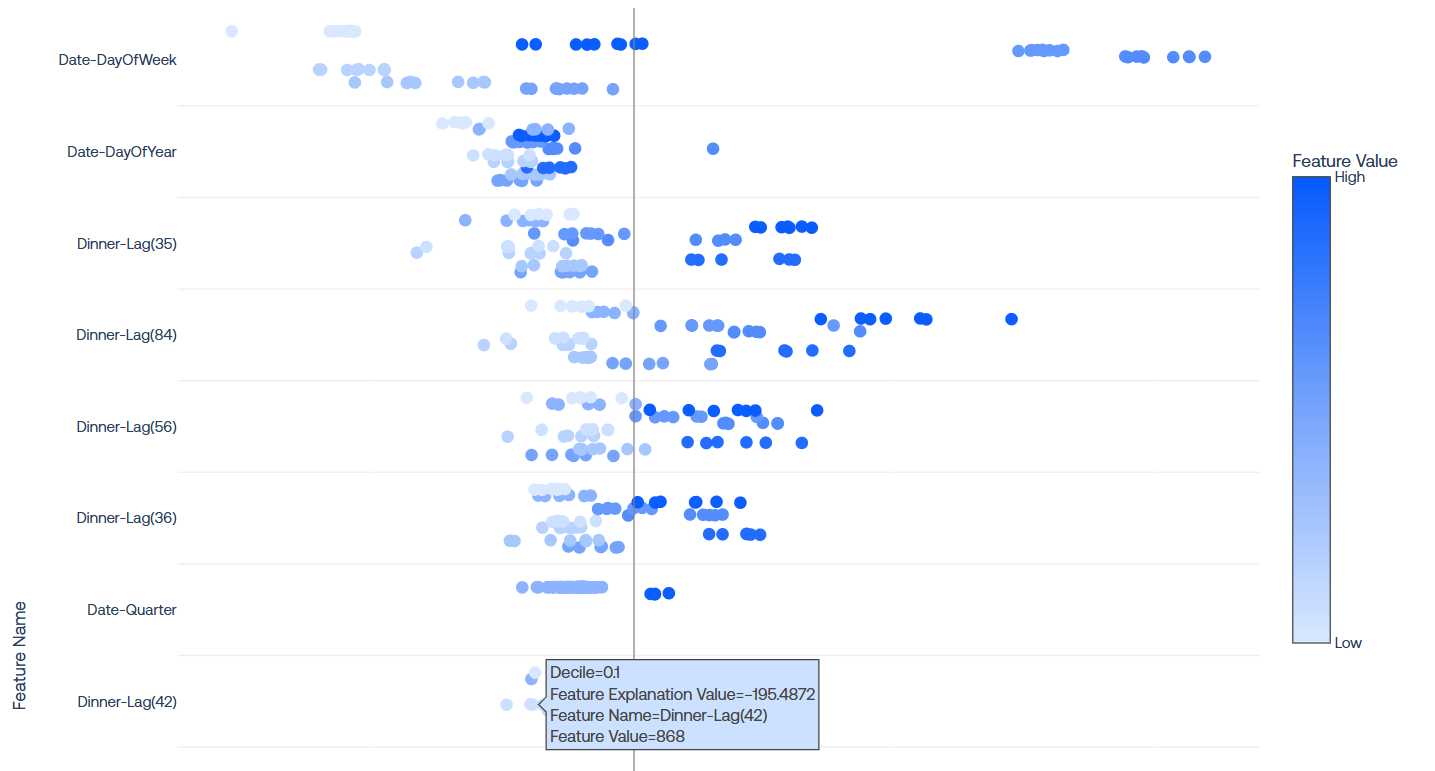
The Beeswarm page showcases the Beeswarm Feature Explanation visual which portrays the SHAP values for each individual prediction value for the selected Forecast Versions for the selected model from the model arena table.
There are several dimensions in this visual that all contribute meaningful information. The y-axis holds different sections for each utilized feature. The x-axis holds information about the feature explanation values, or the feature’s feature’s contribution o the final prediction value. Values to the left of the vertical line down the middle had negative contributions (they brought the prediction value down), while values to the right had positive contributions (they brought the prediction value up). The third dimension is the color of each dot, which signifies the relative value of the given feature on the date of the forecast. The colors are relative to the feature name, so while a feature value of 7 would be high for the Date-DayOfWeek feature (dark blue), a feature value of 7 would be low for the Date-DayOfYear feature (light blue).
The tooltips on each dot display exact values for each of these dimensions and also include the decile (the 10% bucket ranges of feature values relative to the feature). The underlying data for the beeswarm visualization (excluding the feature values) may be downloaded by clicking on the download icon in the top right of the visual.
Tug of War
The Tug of War page shows similar information to that of the Beeswarm page, but in a different manner. Users are presented with a time series visualization including the base prediction value (the prediction value without any feature contributions incorporated), the actual predicted values, and a stacked bar for each prediction date containing the 5 most positively significant and 5 most negatively significant features in terms of their contributions to prediction values.
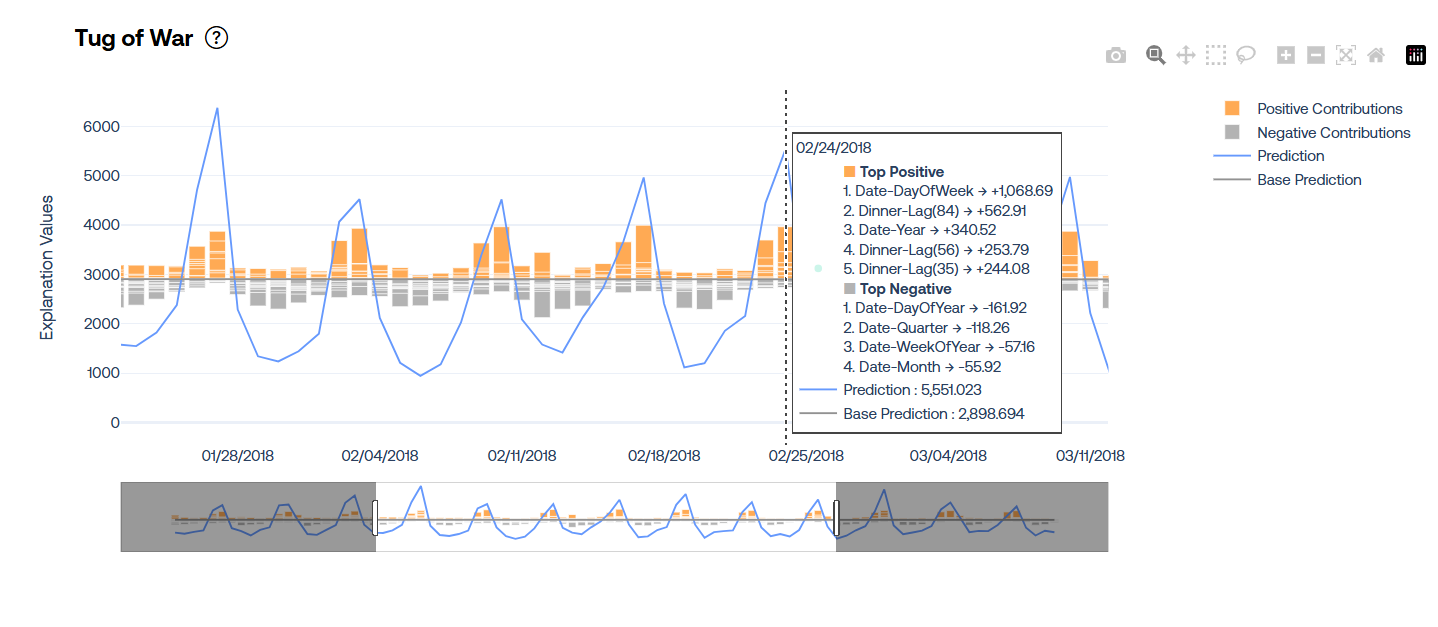
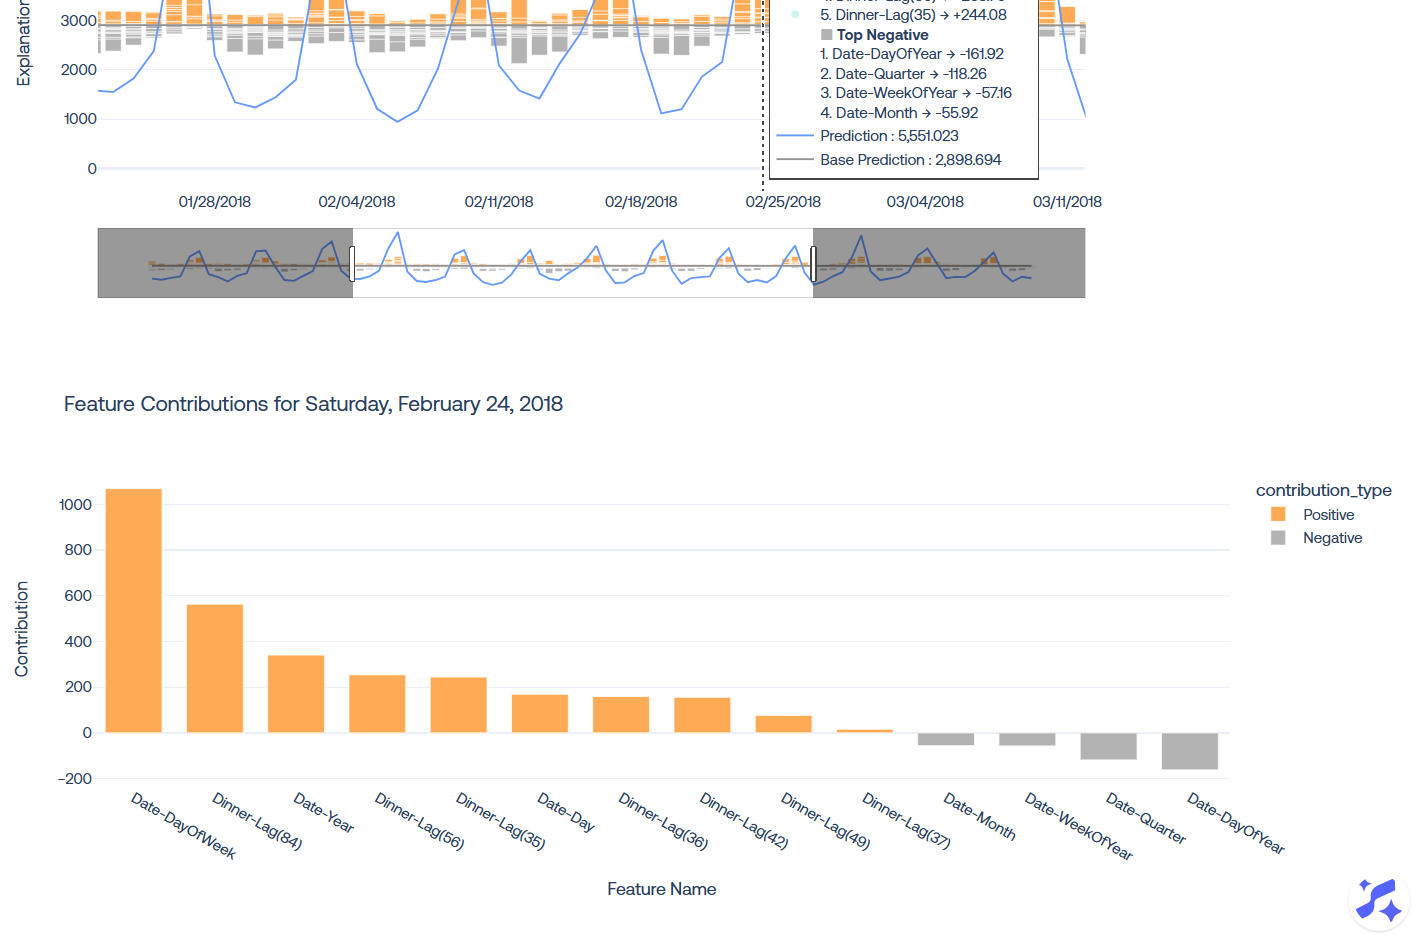
Users may click on a given prediction date to expand the visual and display all contributions to the specific date, rather than just the 5 most significant in either direction.
Waterfall (Utilization Only)
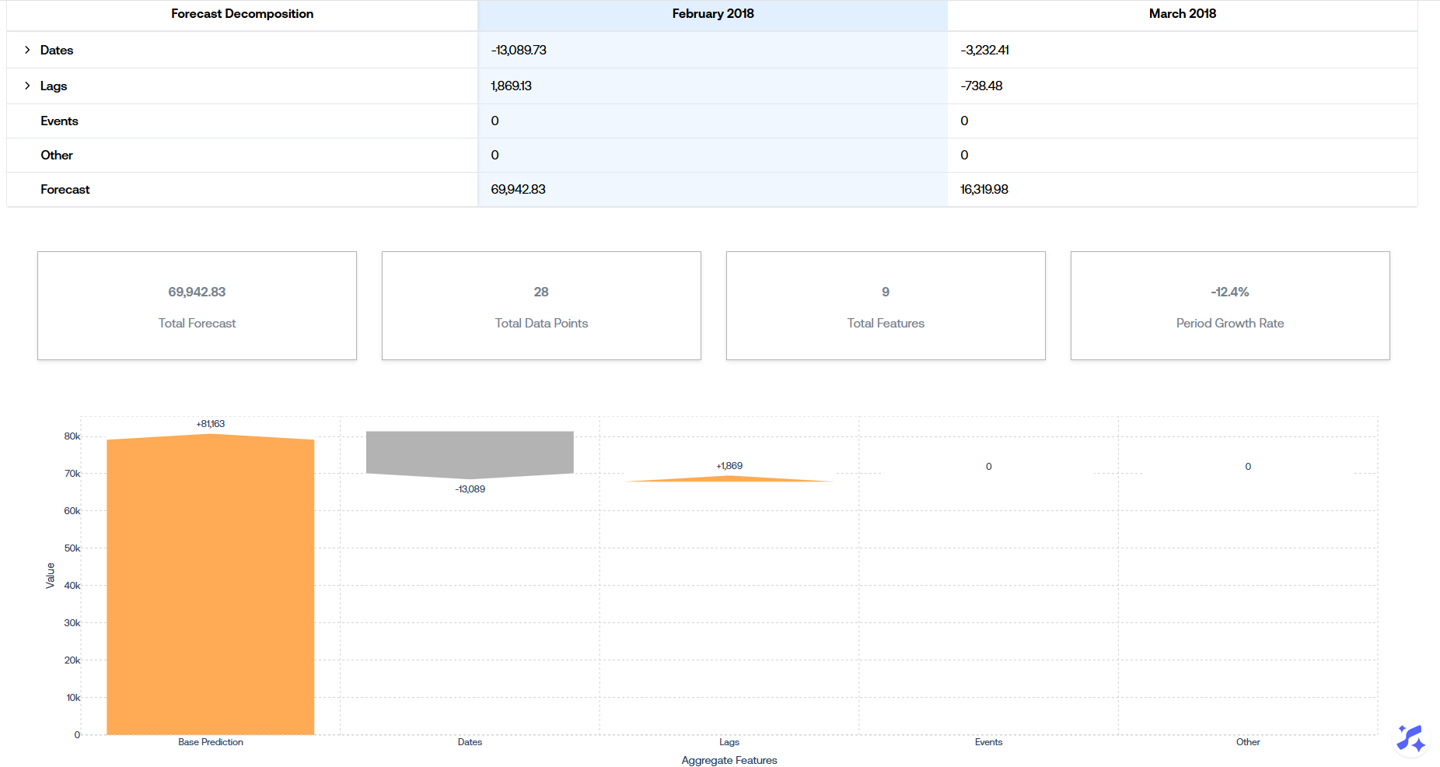
The Waterfall page is only present in the utilization stage of a project. The visual is scope to a single forecast, meaning the user must select from one of the selected Forecast Versions. The waterfall visual aggregates the total contribution values across the feature groups across the entire forecast range. There are several key statistics shown along the top including:
-
Total Forecast: the sum of all the predictions from the selected forecast.
-
Total Data Points: the number of prediction values created over the forecast range.
-
Total Features: the number of features utilized in the forecast.
-
Period Growth Rate: the total forecast value compared to the actuals from the same period of the prior year.
In the example below, the Period Growth Rate is 17.83%, the Total Forecast is 42,180.04, and the forecast period is from January 1, 2018 - January 7, 2018. This means that the sum of the actuals from January 1, 2017 - January 7, 2017 is 34,655.13, or 17.83% less than this periods forecast.
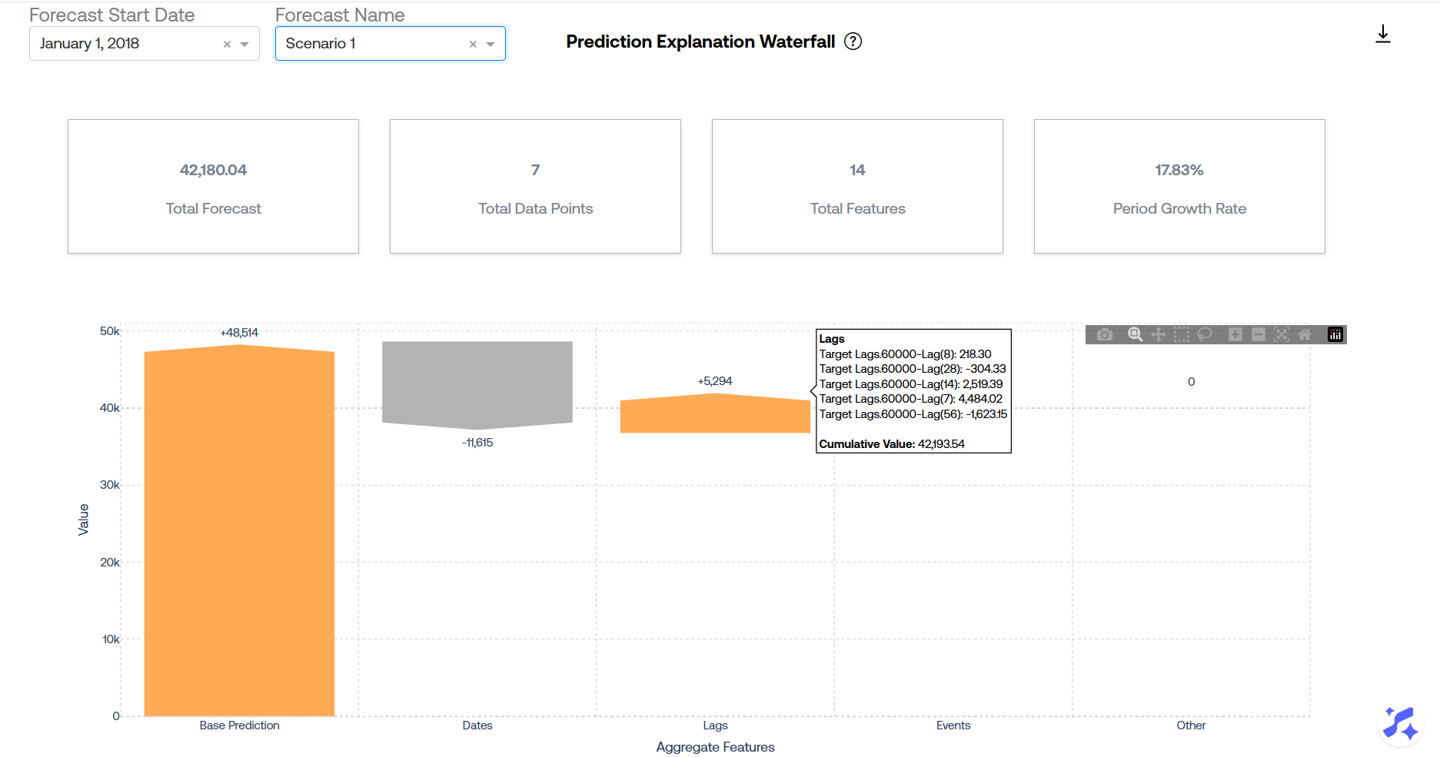
The waterfall visual can be read from left to right, where we first start with the total base prediction. Then the total contribution of all date features are combined (added or subtracted) to the base prediction value, and so on for each group of features. At the end, we arrive at the Total Forecast value over the forecast period.
The underlying data driving this visualization may be downloaded by clicking on the download icon in the top right hand side of the visual.
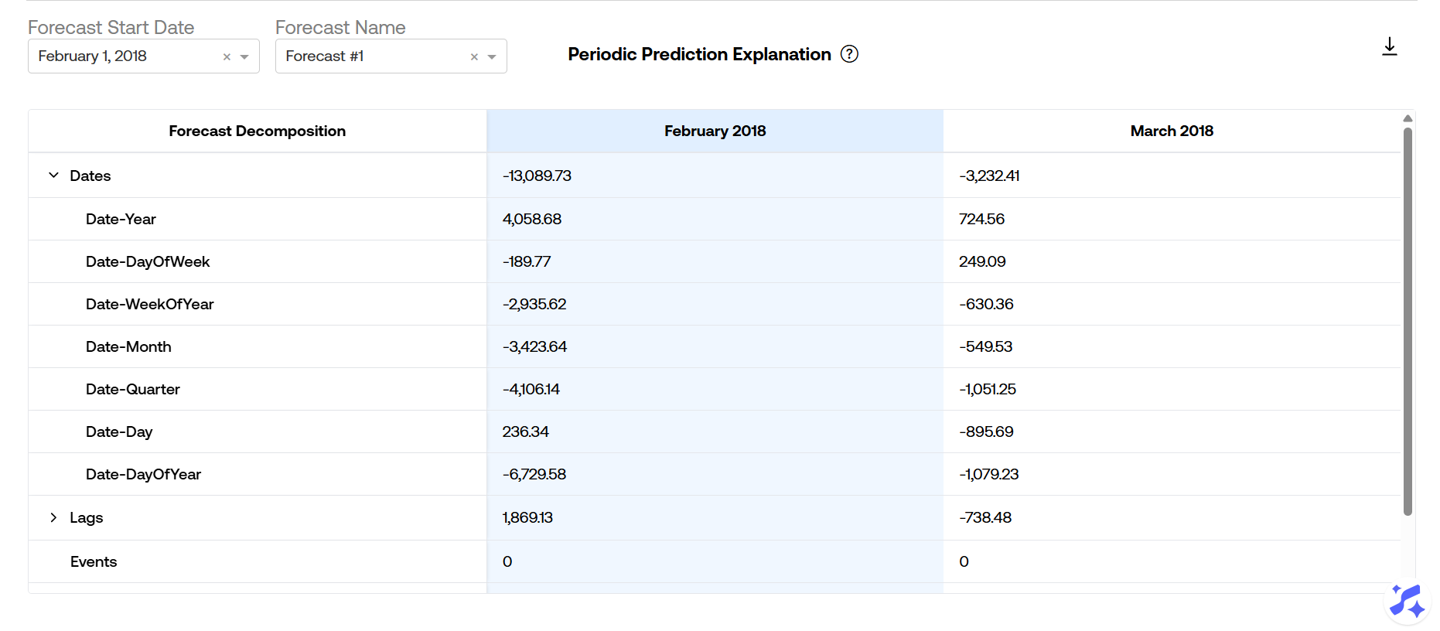
Periodic Explanations (Utilization Only)
The Periodic Explanations page is only present in the utilization stage of a project. Similar to the Waterfall page, this page is scoped to a single forecast version, so a selection must be made. The first display on this page is a hierarchical table displaying the aggregate feature contributions grouped by each month included in the forecast. This provides a more granular breakdown of feature contributions over specific periods. Again, features are grouped into buckets determined by the Feature Grouping dropdown.
 Users may click on the month name column header to generate the waterfall visual for the given month. This visual is exactly the same as that of the Waterfall page except that it is zoomed in to the individual month that was selected.