Combatting Feature and Concept Drift in SensibleAI Forecast
Introduction
Machine learning and AI models in production don't exist in a static world. The data they were trained on represents a snapshot in time, but real-world patterns evolve. This evolution can silently erode forecast accuracy if left unaddressed. SensibleAI Forecast provides multiple mechanisms to detect and combat these changes, ensuring your forecasts remain reliable over time.
Understanding Drift: Why It Matters
What is Feature Drift (Data Drift)?
Feature drift occurs when the statistical properties of your input features change over time. For example, if your model was trained on historical sales data where average transaction values ranged from $50-$200, but economic conditions shift those values to $80-$350, your model is now operating outside the data ranges it learned from. The relationships it discovered may no longer apply.
Common causes of feature drift include seasonal shifts, market changes, new product introductions, economic fluctuations, and changes in data collection methods.
What is Concept Drift?
Concept drift occurs when the underlying relationship between your features and target variable changes. Even if your input data looks similar, the patterns that once predicted outcomes accurately no longer hold true. For instance, customer purchasing behavior that historically correlated strongly with certain demographic features may shift due to changing preferences, competitive landscape, or external events.
Concept drift is particularly insidious because your features may appear normal while the model's predictions quietly degrade.
Why Combatting Drift is Critical
Unaddressed drift leads to degraded forecast accuracy over time, eroded trust in ML-driven decisions, delayed detection of model issues, and increased manual intervention and oversight. SensibleAI Forecast addresses these challenges through four key capabilities.
How SensibleAI Forecast Manages Drift
1. Model Health Scores
Model Health Scores provide visibility into "in production" model accuracy. Every model and Target maintains a Health Score that is updated as new actuals are received into OneStream.
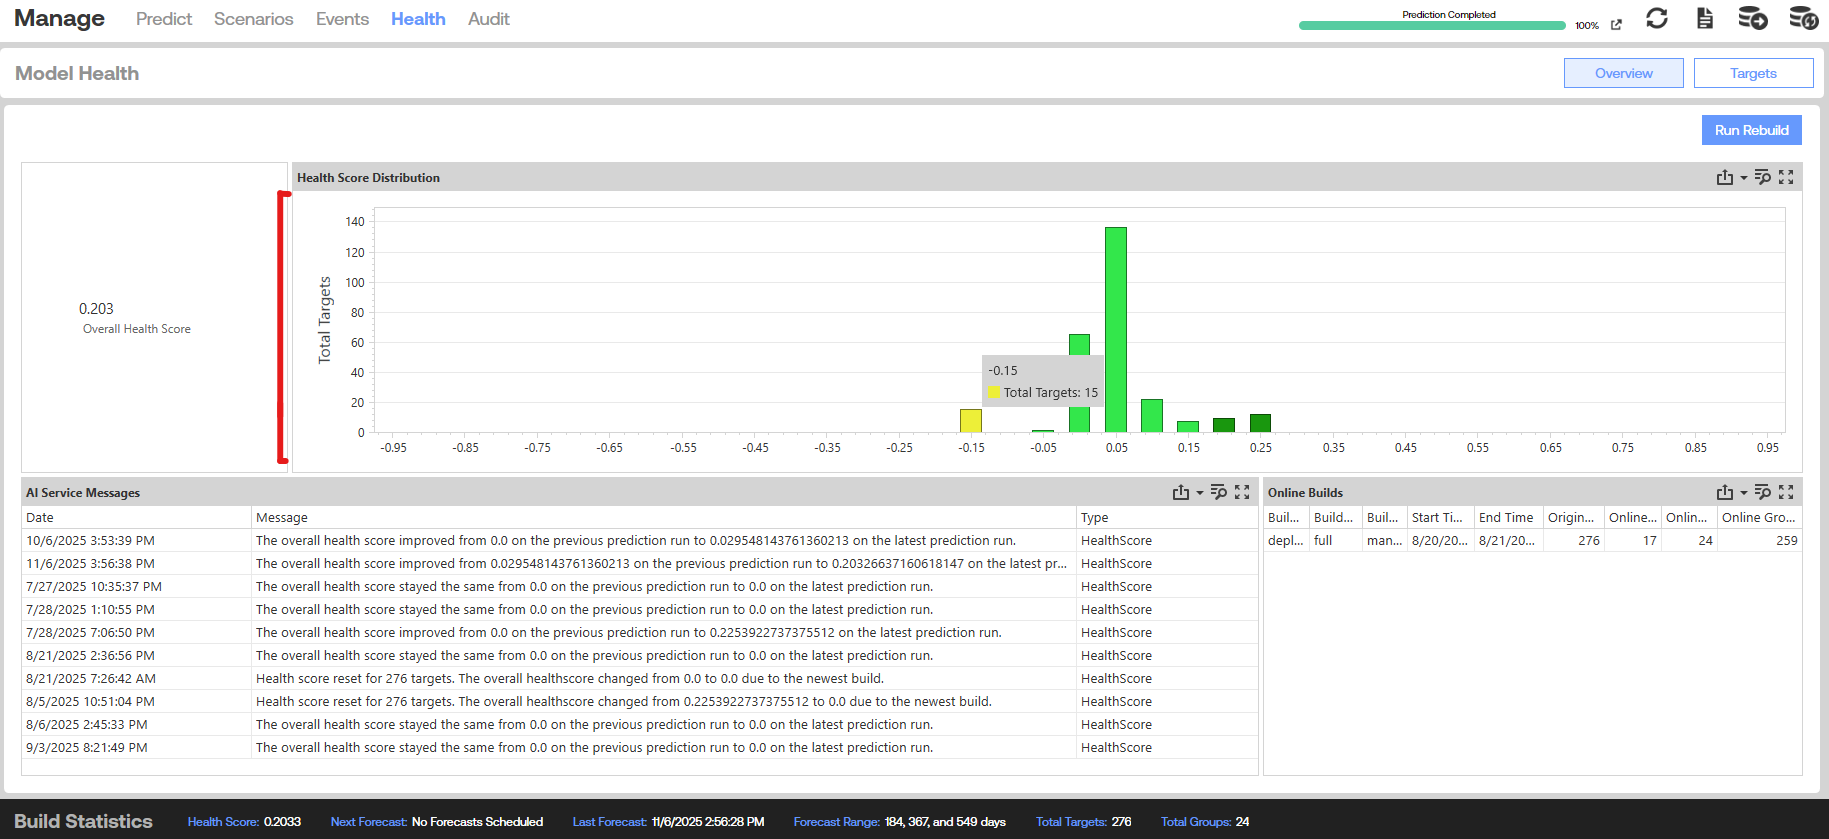
How to interpret Health Scores:
- A score greater than 0 indicates the model and Target accuracy has improved since initially entering production
- A score less than 0 indicates the model and Target accuracy has degraded
- Health Scores act as a concept drift proxy across Targets and models
Visibility: Health Scores are displayed at the individual Target level, model level, and aggregate level throughout the solution. They appear as single metric scores and are visualized in monitoring plots.
Actionable insights: As Health Scores degrade below certain thresholds, the system automatically recommends Model Rebuilds to the user, ensuring proactive intervention before accuracy degrades significantly.
2. Model Rebuilds
Model Rebuilds allow users to completely rebuild a project, typically completing in a matter of hours.
What it combats: Both Feature Drift and Concept Drift
How it helps: A full rebuild allows the system to learn new non-linear Target-to-feature relationships, incorporate updated feature ranges, and identify optimal models to use on a go-forward basis.
This is the most comprehensive response to drift, essentially retraining your forecasting system on the current state of your data and relationships.
3. Retrain with Latest Data
The solution allows users to "refit" existing models for every Target with the latest available data directly prior to generating a forecast. This is configured as part of the forecast generation process and adds only a few minutes of extra processing time.
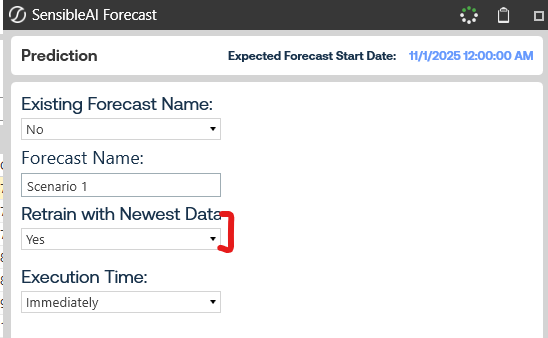
What it combats: Feature Drift
How it helps: This ensures new feature data ranges are incorporated into every model as new actuals are uploaded. While it maintains the existing model structure, it updates the model's understanding of current data distributions.
Recommendation: We recommend customers always set this option to "Yes" for optimal forecast accuracy.
4. Target vs. Feature Value Plots
SensibleAI Forecast includes numerous visualization tools that allow users to spot data drift changes over time as they relate to Target data ranges.
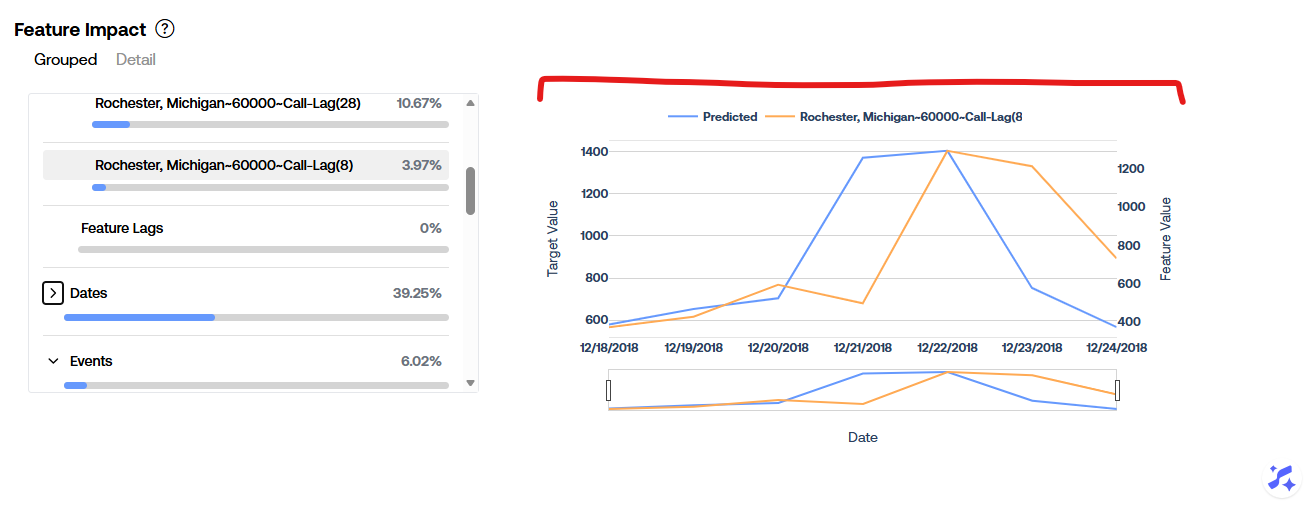
How it helps: These plots enable users to visually identify when feature distributions or Target-feature relationships have shifted, supporting informed decisions about when to trigger Model Rebuilds or investigate data quality issues.
Summary
Capability | Combats Feature Drift | Combats Concept Drift | User Action Required |
|---|---|---|---|
Model Health Scores | Indirect (detection) | Yes (detection) | Monitor scores |
Model Rebuilds | Yes | Yes | Initiate rebuild |
Retrain with Latest Data | Yes | No | Enable in forecast settings |
Target vs. Feature Plots | Yes (detection) | Indirect (detection) | Review visualizations |
Best Practices
- Monitor Health Scores regularly to catch drift early
- Enable "Retrain with Latest Data" for all forecast processes
- Schedule periodic Model Rebuilds based on your business cycle and data volatility. We recommend once every 3 months.
- Review Target vs. Feature plots when Health Scores decline to understand the nature of the drift
By leveraging these capabilities together, SensibleAI Forecast ensures your models adapt to changing conditions and maintain forecast accuracy over time.